When someone says “the market was up 1.2% today,” they’re not describing all 6,000+ publicly traded U.S. companies. They’re describing a single number: a stock market index.
Indexes are the scoreboard of capitalism. They compress the collective performance of dozens, hundreds, or thousands of companies into a single data point that tells investors — at a glance — how markets are moving. Understanding what indexes are, how they’re built, and why they matter transforms how you interpret financial news and make investment decisions.
What Is a Stock Market Index?
A stock market index is a statistical measure that tracks the performance of a selected group of stocks, representing a specific market segment, sector, country, or investment style.
The index itself is not an investment — it’s a benchmark. You can’t buy “the S&P 500” directly. But you can buy funds that track it — which is where index investing becomes one of the most powerful strategies available to ordinary investors.
The three functions of market indexes:
- Benchmarking — Measuring portfolio performance against a standard (“Did I beat the market?”)
- Market temperature — Providing a quick read on overall market sentiment and direction
- Investment vehicle — Serving as the basis for index funds and ETFs that anyone can buy
The Major U.S. Stock Market Indexes
| Index | Founded | Components | Weighting Method | What It Represents |
|---|---|---|---|---|
| S&P 500 | 1957 | 500 companies | Market-cap weighted | Large-cap U.S. stocks; the most widely followed benchmark |
| Dow Jones Industrial Average | 1896 | 30 companies | Price-weighted | 30 blue-chip U.S. companies; oldest major index |
| Nasdaq Composite | 1971 | 3,000+ companies | Market-cap weighted | All Nasdaq-listed stocks; heavy technology weighting |
| Nasdaq-100 | 1985 | 100 companies | Market-cap weighted | 100 largest non-financial Nasdaq companies; the “tech index” |
| Russell 2000 | 1984 | 2,000 companies | Market-cap weighted | Small-cap U.S. stocks; indicator of domestic economy health |
| Russell 3000 | 1984 | 3,000 companies | Market-cap weighted | ~96% of all investable U.S. stocks by market cap |
| Wilshire 5000 | 1974 | ~3,400 companies | Market-cap weighted | Broadest U.S. equity index; “total market” |
How Indexes Are Calculated: The 3 Weighting Methods
Not all indexes are built the same way. The weighting methodology determines how much influence each component stock has on the overall index level — and has significant implications for how the index behaves.
1. Market-Cap Weighting (Most Common)
Used by: S&P 500, Nasdaq, Russell indexes, MSCI indexes
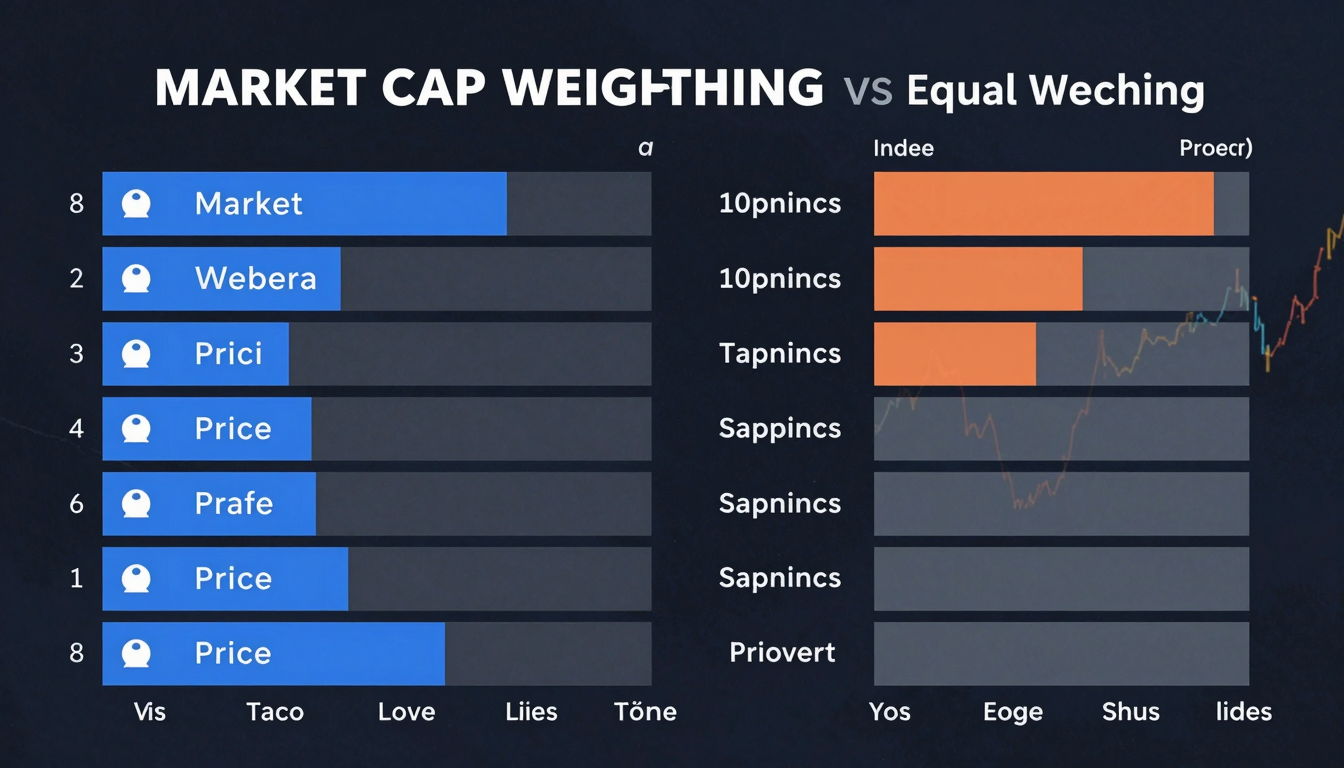
Each stock’s weight in the index is proportional to its market capitalization (share price × shares outstanding). The largest companies have the most influence.
Example — S&P 500: Apple, Microsoft, Nvidia, Amazon, and Alphabet collectively represent roughly 25–30% of the entire index. A 5% move in Apple moves the S&P 500 more than a 50% move in a small component.
Advantage: Naturally reflects economic reality — larger companies deserve more weight because they represent more of the economy’s total value.
Disadvantage: Concentration risk. When large-cap technology stocks are extremely expensive relative to fundamentals, the entire index carries that valuation risk disproportionately.
2. Price Weighting (Historical Method)
Used by: Dow Jones Industrial Average
Each stock’s weight is determined solely by its share price — not its market cap. A $300 stock has three times the influence of a $100 stock, regardless of company size.
Example — DJIA: UnitedHealth Group (priced at ~$500+) has more index weight than Apple (priced at ~$180), even though Apple’s market cap is several times larger.
Why it’s outdated: Share price alone is arbitrary — companies can split their stock to lower price or do reverse splits to raise it. Price weighting creates distortions that market-cap weighting avoids. The DJIA persists primarily because of its 125+ year history and brand recognition, not methodological superiority.
3. Equal Weighting
Used by: RSP (Invesco S&P 500 Equal Weight ETF) and specialty indexes
Every component receives an identical weight regardless of market cap or price. In an equal-weighted S&P 500, each of the 500 stocks represents 0.2% of the index.
Advantage: More exposure to smaller companies within the index; historically outperforms market-cap weighted over very long periods (value tilt).
Disadvantage: Higher turnover (requires frequent rebalancing), higher costs, and underperforms when large-caps are driving market gains (as in 2023–2024).
Key Global Stock Market Indexes
| Index | Country/Region | Components | Key Feature |
|---|---|---|---|
| FTSE 100 | United Kingdom | 100 companies | London Stock Exchange’s largest companies |
| DAX 40 | Germany | 40 companies | Germany’s largest listed companies; total return index |
| Nikkei 225 | Japan | 225 companies | Japan’s most watched index; price-weighted |
| Hang Seng | Hong Kong | 80 companies | HK’s benchmark; includes mainland Chinese listings |
| CSI 300 | China | 300 companies | Top 300 stocks on Shanghai + Shenzhen exchanges |
| MSCI World | Global (Developed) | 1,500+ companies | 23 developed market countries; global benchmark |
| MSCI Emerging Markets | Global (Emerging) | 1,400+ companies | 24 emerging market countries including China, India, Brazil |
Why Index Funds Beat Most Active Managers
The most important practical implication of understanding indexes: you can invest in them directly through index funds — and doing so outperforms the vast majority of professional fund managers over the long term.
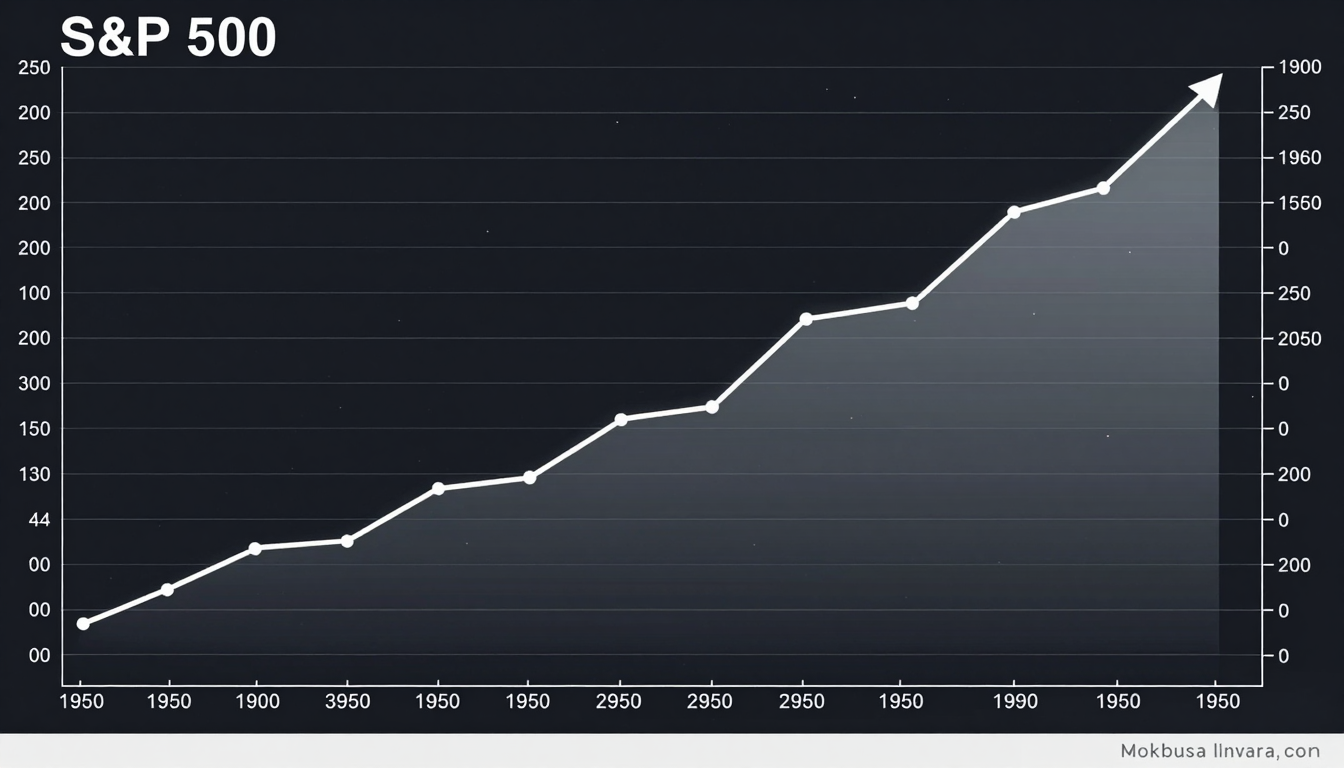
The S&P 500 has returned approximately 10% annually on average over the last century. The percentage of actively managed large-cap funds that beat the S&P 500 over 15-year periods: roughly 10–15%. The other 85–90% underperform — and that’s before accounting for taxes on higher turnover.
Why it’s so hard to beat an index:
- Cost drag — Active funds charge 0.5–1.5% annually; index funds charge 0.03–0.10%. That gap compounds enormously over decades.
- Information efficiency — Modern markets incorporate publicly available information quickly. Consistent edges based on public data are rare.
- Behavioral drag — Active managers face pressure to “do something” during volatile markets. Index funds have no such pressure — they simply hold.
- Survivorship bias — Underperforming funds are closed or merged, making the published track record of “active management” look better than reality.
How to Invest in an Index
You invest in an index through index funds or ETFs that track it. Both hold the same underlying stocks in the same proportions as the index — the difference is structural:
| Feature | Index Mutual Fund | Index ETF |
|---|---|---|
| Trading | Once per day at NAV | Intraday, like a stock |
| Minimum investment | Often $1–$3,000 | Price of one share (or fractional) |
| Tax efficiency | Good | Slightly better (in-kind redemptions) |
| Expense ratio | 0.03–0.15% | 0.03–0.20% |
| Best for | Automatic monthly investing | Flexible buying/selling, taxable accounts |
Most popular index funds/ETFs by index:
- S&P 500: VOO, IVV, FXAIX, SPY
- Total US Market: VTI, FSKAX, SWTSX
- Nasdaq-100: QQQ, QQQM
- Total World: VT, FWWFX
- International Developed: VEA, FSPSX
- Emerging Markets: VWO, FPADX
Reading an Index: What the Numbers Actually Mean
The raw number of an index (S&P 500 at 5,300, for example) is meaningless in isolation — it’s an arbitrary starting value scaled over time. What matters is:
- Percentage change: “The S&P 500 is up 1.2%” is meaningful. “The S&P 500 is at 5,342” alone is not.
- Year-to-date return: How the index has performed since January 1st of the current year.
- Trailing 1/3/5/10-year returns: Long-term context that smooths out short-term volatility.
- P/E ratio of the index: The aggregate valuation of all components — useful for assessing whether the overall market is cheap or expensive relative to history.
Sector Indexes: A Layer Deeper
Within broad indexes, sector indexes track specific industries. The S&P 500, for example, is divided into 11 GICS (Global Industry Classification Standard) sectors, each with its own index and corresponding ETF:
| Sector | ETF | S&P 500 Weight (~) |
|---|---|---|
| Information Technology | XLK | ~32% |
| Healthcare | XLV | ~12% |
| Financials | XLF | ~13% |
| Consumer Discretionary | XLY | ~10% |
| Communication Services | XLC | ~9% |
| Industrials | XLI | ~8% |
| Consumer Staples | XLP | ~6% |
| Energy | XLE | ~4% |
| Utilities | XLU | ~2% |
| Real Estate | XLRE | ~2% |
| Materials | XLB | ~2% |
Sector ETFs let investors tilt their portfolio toward sectors they believe will outperform without abandoning diversification entirely.
Common Questions About Stock Market Indexes
Which index is the best to invest in?
For most investors, a total market index (VTI, FSKAX) or S&P 500 index (VOO, FXAIX) is the optimal starting point. Total market funds provide broader diversification including small and mid-cap stocks. S&P 500 funds focus on the largest, most established companies. Over long periods, their returns are very similar.
What’s the difference between the S&P 500 and the Dow Jones?
The S&P 500 contains 500 companies weighted by market capitalization — it’s a far more comprehensive and methodologically sound measure of the US large-cap market. The Dow contains only 30 companies and uses an outdated price-weighting method. Most professional investors use the S&P 500 as their primary US market benchmark.
Can an index go to zero?
The S&P 500 going to zero would require all 500 companies in it to simultaneously become worthless — which would mean the effective collapse of the U.S. economy. This is theoretically possible but practically equivalent to a scenario where money itself has lost meaning. For any investment horizon measured in years or decades, this risk is not meaningfully distinguishable from zero.
How often is an index rebalanced?
The S&P 500 is rebalanced quarterly, with component changes announced in advance. A company can be added (typically when it meets size, liquidity, and profitability criteria) or removed (due to mergers, delistings, or falling below eligibility thresholds). Index funds automatically adjust to reflect these changes.
Is the stock market index the same as the economy?
No — and this distinction matters. Stock market indexes reflect the collective earnings expectations and valuation of listed public companies, which can diverge significantly from the broader economy (GDP growth, unemployment, etc.). In 2020, stocks recovered to all-time highs while millions remained unemployed. Markets are forward-looking and often disconnect from current economic conditions.
For a deeper dive into how markets work and how to invest in them, see our guides on stock market for beginners, how to invest in stocks, and our framework for best stocks to invest in.
📚 Complete Your P5 Foundation
- Stock Market for Beginners — complete foundation guide
- How to Invest in Stocks — step-by-step process
- Best Stocks to Invest In — the 5-Factor selection framework
Leave a Reply