
Every investor, at some point, will live through a stock market crash. The question isn’t whether it will happen — it’s whether you’ll be prepared when it does.
A stock market crash is a sudden, severe decline in stock prices — typically defined as a drop of 20% or more from recent highs, occurring rapidly over days or weeks. Crashes are distinct from bear markets (which can unfold slowly over months) in their speed and the panic they generate.
Understanding what causes crashes, how they’ve played out historically, and how to position yourself before, during, and after them is one of the most valuable skills a long-term investor can develop.
What Causes a Stock Market Crash?
Crashes rarely have a single cause. They typically involve a combination of overvaluation, leverage, and a triggering event that shatters confidence simultaneously across millions of investors.
The 5 Core Causes
| Cause | Mechanism | Historical Example |
|---|---|---|
| Asset Bubble Bursting | Prices disconnected from fundamentals; sentiment reversal triggers mass selling | Dot-com crash 2000, Housing 2008 |
| Economic Shock | Sudden external event destroys earnings expectations across broad sectors | COVID crash March 2020, Oil shock 1973 |
| Credit/Liquidity Crisis | Leverage unwinds rapidly; forced selling amplifies price declines | Financial crisis 2008, LTCM 1998 |
| Monetary Policy Shock | Rapid rate hikes compress valuations; growth stocks most affected | 1987 crash (rate fears), 2022 bear market |
| Panic and Contagion | Fear spreads faster than facts; investors sell first and ask questions later | Black Monday 1987, Flash Crash 2010 |
In practice, most crashes involve multiple causes reinforcing each other. The 2008 financial crisis combined a housing bubble, excessive leverage, a credit freeze, and widespread panic — each amplifying the others.
The 6 Major Crashes: What Happened and How Long Recovery Took
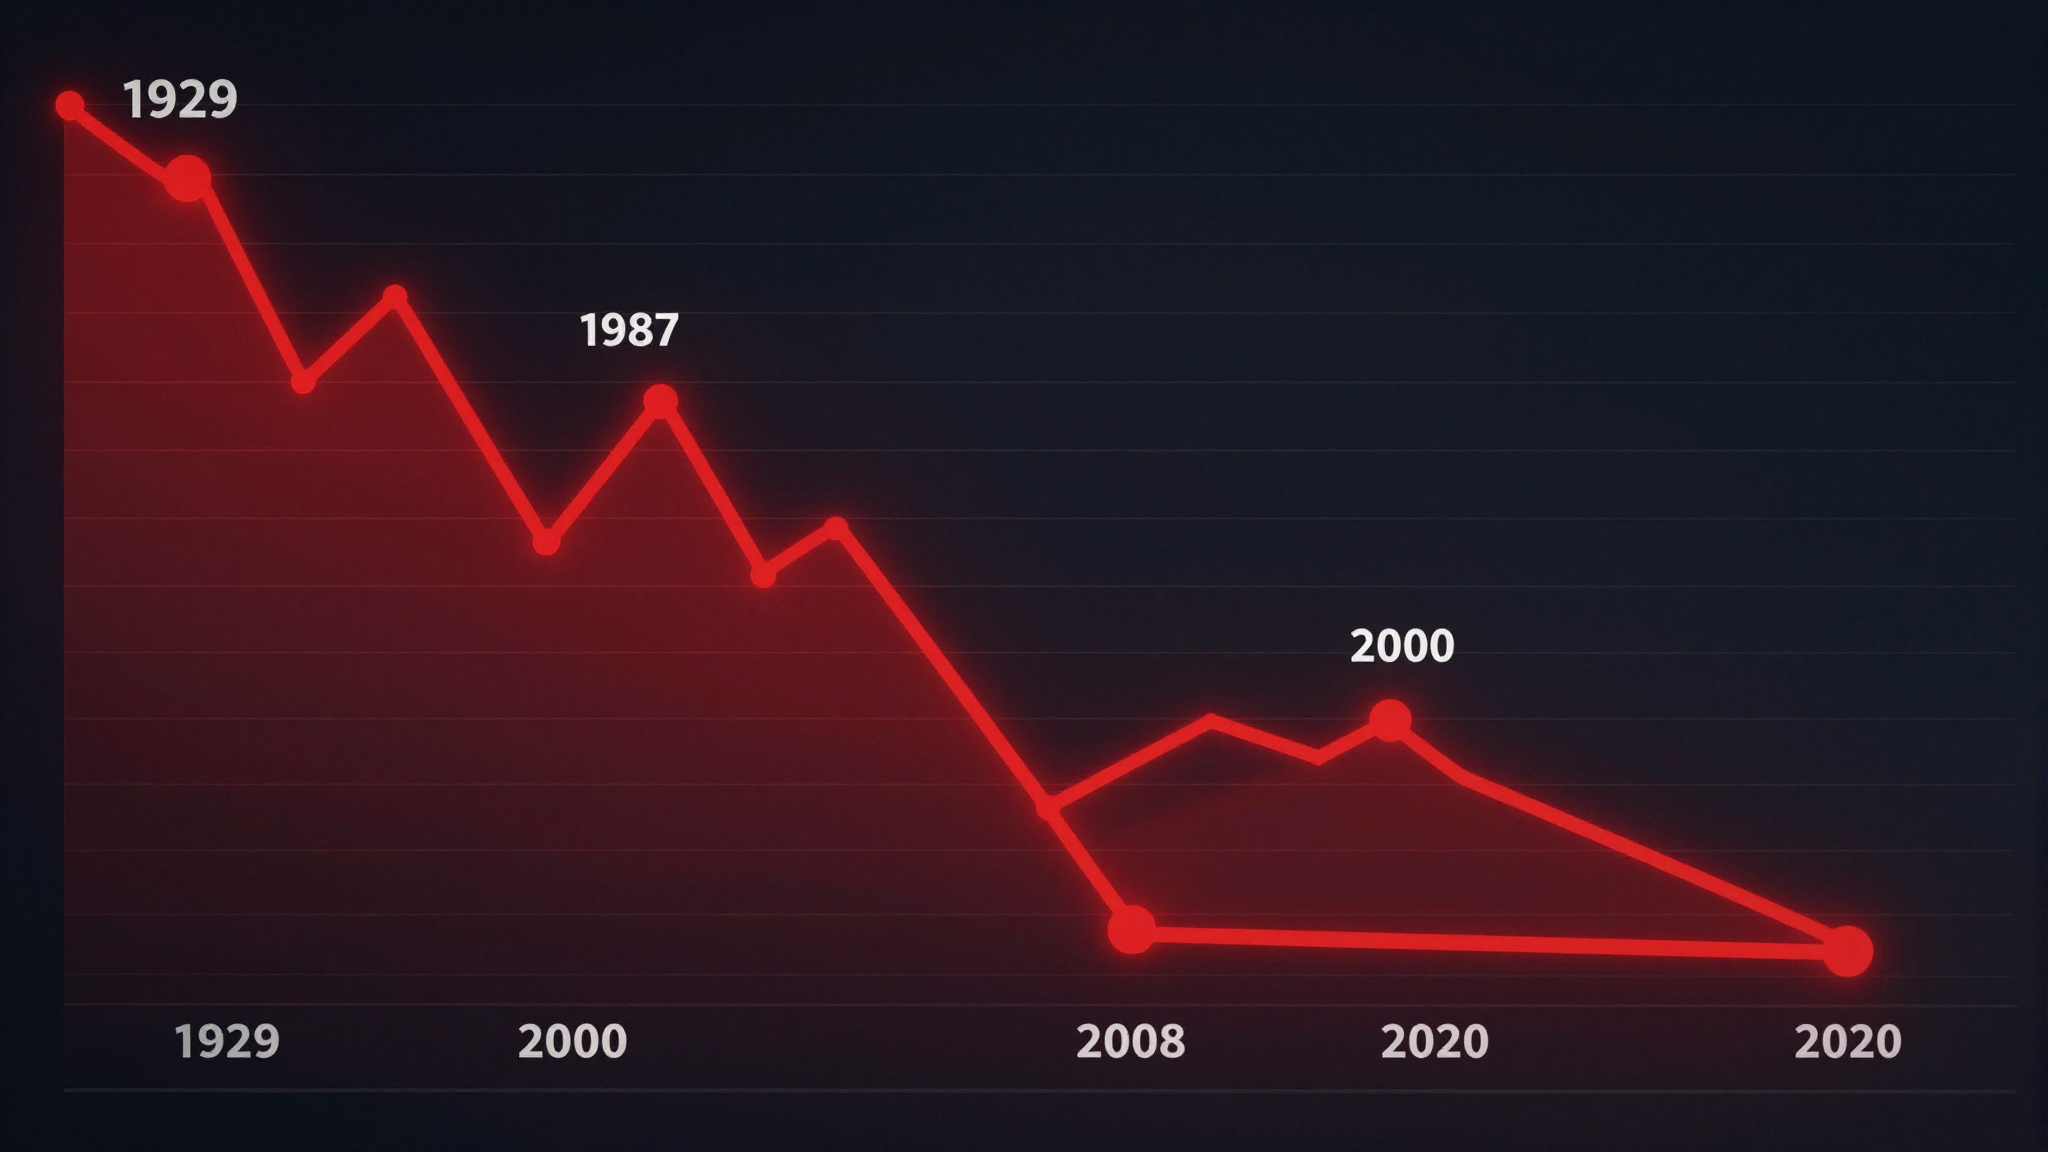
1. The Great Crash — 1929
Peak-to-trough decline: −89% (Dow Jones, 1929–1932)
Recovery time: ~25 years to new highs
The defining crash of the 20th century. A decade of speculative excess, margin buying (investors borrowing 90% of purchase price), and bank failures created a collapse that took the Great Depression to fully manifest. The scale was historically unique — amplified by monetary policy mistakes and protectionist trade policies.
2. Black Monday — 1987
Single-day decline: −22.6% (Dow, October 19, 1987)
Recovery time: ~2 years to new highs
The largest single-day percentage decline in Dow history. Triggered by rising interest rates, trade deficit concerns, and amplified by computer-driven “portfolio insurance” strategies that automatically sold as prices fell, creating a feedback loop. Markets recovered relatively quickly — the economy was fundamentally sound.
3. Dot-Com Crash — 2000–2002
Peak-to-trough decline: −78% (Nasdaq), −49% (S&P 500)
Recovery time: ~7 years (S&P 500), Nasdaq took 15 years
The internet bubble inflated valuations of unprofitable companies to absurd levels. When profitability reality set in, the collapse was brutal — particularly for technology stocks. Companies with no earnings and astronomical P/E ratios fell 90–99%.
4. Global Financial Crisis — 2008–2009
Peak-to-trough decline: −57% (S&P 500)
Recovery time: ~5.5 years to new highs
The most systemic crash since 1929. The collapse of the US housing market triggered a credit freeze that threatened the global banking system. Bear Stearns, Lehman Brothers, and AIG all failed or required emergency intervention. The Fed cut rates to zero and launched unprecedented quantitative easing.
5. COVID Crash — 2020
Peak-to-trough decline: −34% (S&P 500) in 33 days
Recovery time: ~5 months — fastest recovery in history
The fastest crash in market history. Global lockdowns created an economic stop unlike anything seen before. But massive fiscal stimulus ($2T+ CARES Act), Federal Reserve intervention, and vaccine optimism produced an equally unprecedented recovery. Investors who sold at the bottom missed one of the strongest bull runs in decades.
6. 2022 Bear Market
Peak-to-trough decline: −27% (S&P 500), −38% (Nasdaq)
Recovery time: ~20 months for S&P 500
Triggered by the fastest Fed rate-hiking cycle in 40 years to combat post-COVID inflation. Growth stocks and speculative assets (crypto, SPACs, unprofitable tech) fell dramatically — some 70–90% from peaks. Value and dividend stocks held up considerably better.
The Psychology of a Crash: Why Investors Make It Worse
Market crashes are as much psychological events as financial ones. Understanding the behavioral patterns that amplify crashes helps you avoid them.
The Panic Selling Loop
When prices fall sharply, fear triggers selling. Selling triggers more price declines. More price declines trigger more fear. This feedback loop can send markets well below any rational estimate of fundamental value — which is precisely why crashes create extraordinary buying opportunities for those who don’t panic.
Recency Bias
During a crash, investors extrapolate recent declines indefinitely into the future. “This will never recover” is the dominant narrative at market bottoms. In reality, every major crash in history has eventually been followed by new highs — including the Great Depression, though it took 25 years.
The Disposition Effect
Investors tend to sell winners quickly (to lock in gains) and hold losers too long (to avoid realizing losses). During crashes, this means they sell quality companies that have declined and hold onto speculative positions that may not recover.

The Crash Survival Playbook: 7 Rules
Rule 1: Do Nothing (If Your Portfolio Was Right Before)
The single most important crash rule. If you built a diversified, quality portfolio before the crash, the correct response to a 20–30% decline is almost always to do nothing. Selling locks in losses and removes you from the recovery.
The data is unambiguous: investors who stayed invested through every major crash since 1987 dramatically outperformed those who tried to time the market. Missing just the 10 best trading days in any given decade cuts long-term returns roughly in half.
Rule 2: Never Sell Because of Price Alone
Price is not a reason to sell. Business deterioration is. Ask the right question: Has the underlying business fundamentally changed, or has only the stock price changed? If your company is still generating cash, still has its competitive moat, and the reason you bought it is still intact — the crash has made it cheaper, not worse.
Rule 3: Rebalance Into Strength
Crashes are rebalancing opportunities. If equities have fallen from 70% to 55% of your target allocation (because prices dropped), buying stocks to restore your target allocation means systematically buying low. This is mechanically forced buying at depressed prices — exactly what you want.
Rule 4: Dollar-Cost Average Aggressively
Crashes are the best times to deploy regular investment contributions. The same $500/month buys significantly more shares at market lows than at highs. For a full framework on this strategy, see our guide on dollar-cost averaging.
Rule 5: Avoid Leverage Completely
Margin debt amplifies losses and introduces forced selling at the worst possible time. When prices fall, margin calls force you to sell — often at the exact bottom — regardless of your conviction in the investment. Crashes regularly bankrupt investors who were directionally correct but used leverage.
Rule 6: Keep Cash Reserves for Opportunities
Legendary investors — Buffett, Lynch, Templeton — consistently held cash reserves not as a defensive measure but as ammunition for crashes. A 10–15% cash position that you deploy during a 30% market decline can dramatically improve long-term returns. Crashes are not just risks to survive — they’re opportunities to exploit.
Rule 7: Have a Written Investment Policy
Write down your investment strategy, risk tolerance, and planned response to a 30% decline — before a crash happens. When markets are falling and every headline screams disaster, you will not make good decisions from scratch. A pre-written policy gives you something to execute mechanically, removing emotion from the process.
Why Crashes Create the Best Long-Term Buying Opportunities
The most counterintuitive truth in investing: crashes are good for long-term investors who don’t need their money immediately.
| Crash | S&P 500 Return 1 Year After Bottom | S&P 500 Return 3 Years After Bottom | S&P 500 Return 5 Years After Bottom |
|---|---|---|---|
| 1987 Black Monday | +23% | +53% | +91% |
| 2002 Dot-com bottom | +29% | +61% | +82% |
| 2009 Financial crisis | +69% | +98% | +178% |
| 2020 COVID bottom | +75% | +89% | +110%* |
*COVID 5-year return through 2025 estimated
In every case, investors who bought at the height of panic — when the news was worst and confidence was lowest — earned extraordinary returns in the years that followed. Crashes are the market’s clearance sales.
How to Position Your Portfolio Before a Crash
You can’t predict when a crash will come, but you can build a portfolio that survives one without requiring you to sell at the worst moment.
- Quality over speculation: Companies with strong balance sheets, positive free cash flow, and durable competitive advantages fall less and recover faster. Speculative positions with no earnings often fall 70–90% and may not recover for a decade.
- Avoid excessive leverage: No margin debt. If you can’t afford a 50% loss without being forced to sell, you have too much risk.
- Maintain a cash buffer: 10–20% in cash or short-term bonds gives you both psychological comfort and buying power when opportunities appear.
- Diversify across sectors: Healthcare, consumer staples, and utilities historically fall significantly less in crashes than technology and discretionary sectors.
- Don’t over-concentrate in recent winners: The sectors that lead bull markets often lead crashes. Trim positions that have grown beyond your target allocation.
For a complete beginner framework on building a portfolio that can weather any market, see our guide on stock market for beginners, and for the step-by-step investing process, how to invest in stocks.
Common Questions About Stock Market Crashes
How often do stock market crashes happen?
Corrections (−10% or more) happen roughly every 1–2 years. Bear markets (−20% or more) occur approximately every 3–5 years. Severe crashes (−30%+) are rarer — roughly every 7–10 years. You will experience multiple major crashes in an investing lifetime. Accepting this as normal is the foundation of long-term investment success.
How long does it take to recover from a crash?
Recovery times vary enormously. The COVID crash recovered in 5 months; the Great Depression took 25 years. The average recovery from major bear markets since WWII is approximately 2–3 years. Crucially, these are total-return recoveries including dividends — which is why dividend reinvestment significantly accelerates recovery.
Should I sell everything before a crash?
Almost certainly not. To profit from this strategy, you’d need to correctly predict both when to sell and when to buy back — twice in a row. Research consistently shows that even professional investors can’t do this reliably. Investors who try to time crashes typically miss the recovery and end up worse off than if they’d done nothing.
Is a crash the same as a bear market?
Not exactly. A bear market is defined as a 20%+ decline from peak, which can unfold slowly over months. A crash implies speed — a rapid, panic-driven decline. The 2022 bear market unfolded over about 10 months; the 2020 crash reached −34% in 33 days. Both are painful; crashes are simply faster and more psychologically intense.
What’s the best investment during a crash?
Broadly, high-quality stocks with strong balance sheets and pricing power tend to hold up best. Defensives (healthcare, consumer staples, utilities) outperform in most crashes. Gold often performs well as a safe haven. Short-term Treasury bonds provide stability. Cash, while earning little, preserves capital and provides buying power. The “best” choice depends on your timeline and whether you’re preserving capital or seeking to deploy it.
📚 Build Crash-Resilient Knowledge
- Stock Market for Beginners — complete foundation for new investors
- How to Invest in Stocks — step-by-step investing process
- Dollar-Cost Averaging — the crash-proof investing strategy
Leave a Reply