
The stock market can feel like a foreign country with its own language, customs, and rules — confusing at first, but completely learnable once someone shows you the map. This guide is that map.
By the end of this article, you will understand how the stock market actually works, why prices move, what drives long-term returns, and the key concepts every beginner needs before investing a single dollar. No jargon left unexplained. No assumptions about prior knowledge.
What Is the Stock Market?
The stock market is a network of exchanges where buyers and sellers trade ownership stakes in public companies. When a company wants to raise money from the public, it sells shares — small pieces of ownership — through a process called an Initial Public Offering (IPO). After that initial sale, investors trade those shares with each other on exchanges like the New York Stock Exchange (NYSE) or NASDAQ.
The price of each share is set in real time by supply and demand: when more people want to buy a stock than sell it, the price rises. When more want to sell than buy, the price falls.
Two key things to understand from the start:
- You are not gambling in a casino. When you buy stock, you own a real piece of a real business. If that business grows and becomes more profitable, your investment grows in value. The stock market is a mechanism for sharing in the wealth that businesses create.
- The market is a long-term wealth machine with short-term volatility. The S&P 500 — a benchmark index of America’s 500 largest companies — has returned approximately 10% annually on average since 1926. In any given year, it can swing wildly. Over any 20-year period in history, it has never lost money.
Key Stock Market Terms Every Beginner Must Know
Before going further, here are the essential terms you’ll encounter constantly:
| Term | Simple Definition |
|---|---|
| Stock / Share | A unit of ownership in a company |
| Stock Exchange | A marketplace where stocks are bought and sold (NYSE, NASDAQ) |
| Stock Index | A benchmark tracking a group of stocks (S&P 500, Dow Jones, NASDAQ Composite) |
| Bull Market | A sustained period of rising stock prices (up 20%+ from recent lows) |
| Bear Market | A sustained period of falling stock prices (down 20%+ from recent highs) |
| Market Cap | Total value of a company’s outstanding shares (Price × Number of shares) |
| Dividend | A portion of company profits paid to shareholders, typically quarterly |
| Portfolio | Your complete collection of investments |
| Broker | The intermediary platform that executes your buy/sell orders |
| Volatility | How much a stock’s price fluctuates — higher volatility means bigger swings |
| Liquidity | How easily a stock can be bought or sold without significantly affecting its price |
| IPO | Initial Public Offering — when a company first sells shares to the public |
How Stocks Make Money for Investors
Stocks generate returns in two ways:
1. Capital Appreciation
Capital appreciation is the increase in a stock’s price over time. If you buy a stock at $50 and it rises to $80, your $30 gain is capital appreciation. This happens when: the company grows its earnings, the market becomes more optimistic about the company’s future, or both.
Over the long run, capital appreciation is driven primarily by earnings growth. A company that consistently grows profits at 12% annually will see its stock price track that growth over time, even with short-term divergences in either direction.
2. Dividends
Dividends are cash payments made by companies to shareholders, typically quarterly. Not all companies pay dividends — many growth companies reinvest all profits back into the business. But dividend-paying companies, especially those with long histories of increasing dividends, provide a steady income stream alongside any price appreciation.
The total return of a stock investment equals capital appreciation plus dividends reinvested. Historically, dividends have accounted for roughly 40% of the stock market’s total long-term return — a fact many beginners overlook when they focus exclusively on price movements.
Understanding Stock Market Indexes
You’ll hear constant references to “the market” being up or down. What does that mean? It refers to major stock market indexes:
- S&P 500: Tracks 500 large US companies across all major sectors. This is the most widely used benchmark for US stock market performance. When financial media says “the market was up 1% today,” they almost always mean the S&P 500.
- Dow Jones Industrial Average (DJIA): Tracks 30 large US companies. Historically important but less representative than the S&P 500 because it only covers 30 stocks and uses a price-weighted methodology.
- NASDAQ Composite: Tracks all stocks listed on the NASDAQ exchange — heavily weighted toward technology companies. A useful gauge of tech sector performance.
- Russell 2000: Tracks 2,000 smaller US companies (small-cap stocks). Useful for gauging the health of the broader economy beyond large corporations.
Why Stock Prices Move
Understanding why prices change is the key to developing realistic expectations. Stock prices move for three main reasons:
Company-Specific News
Earnings reports, product launches, management changes, mergers, regulatory decisions — any news specific to a company will affect its stock price. Strong earnings typically cause a price jump; missed earnings typically cause a drop. The magnitude depends on how much the news differed from what investors were expecting. A company can report record profits but still see its stock fall if the profits came in below analyst expectations.
Macroeconomic Factors
Interest rates, inflation, GDP growth, unemployment — these broad economic forces affect all stocks simultaneously. Rising interest rates are particularly important: they make bonds more attractive (competing with stocks), increase borrowing costs for companies, and reduce the present value of future earnings. This is why the Federal Reserve’s rate decisions are so closely watched by stock market investors.
Investor Sentiment and Psychology
Markets are driven by human psychology as much as fundamentals. Fear and greed create cycles of overvaluation and undervaluation. During bull markets, investors become increasingly optimistic, bidding prices above fundamental value. During bear markets, fear dominates, pushing prices below fundamental value. These emotional swings create both risk and opportunity — the investor who can stay rational when markets are most emotional has a significant structural advantage.
The Risk-Return Relationship
One of the most fundamental concepts in investing: higher potential returns require accepting higher risk. This isn’t a market design choice — it’s a mathematical necessity. If a “safe” investment reliably produced the same returns as a risky one, everyone would shift to the safe option until prices equalized.
| Investment Type | Historical Annual Return | Typical Worst Year | Recovery Time |
|---|---|---|---|
| Cash / Savings Account | 1–3% | Near 0% | Immediate |
| Government Bonds | 3–5% | -5% to -15% | 1–2 years |
| S&P 500 Index | ~10% | -38% (2008) | 3–5 years |
| Individual Growth Stocks | Variable (can be 20%+) | -50% to -80% | Varies widely |
The practical implication: only invest in stocks money you won’t need for at least 3–5 years. Short time horizons mean you might need to sell during a downturn, locking in losses before the market recovers.

The Power of Compounding
Compounding is why time in the market matters more than timing the market. Compounding means earning returns on your returns — your investment snowball grows larger and faster the longer it rolls.
A concrete example with 10% annual returns:
| Years Invested | $10,000 Initial + $200/month | Total Contributed | Investment Gain |
|---|---|---|---|
| 10 years | $52,400 | $34,000 | $18,400 |
| 20 years | $162,800 | $58,000 | $104,800 |
| 30 years | $452,000 | $82,000 | $370,000 |
| 40 years | $1,184,000 | $106,000 | $1,078,000 |
At 40 years, you contributed $106,000 but the market made you a millionaire. That extra $1,078,000 came entirely from compounding — returns earning returns earning returns. This is why starting early matters dramatically more than starting with more money.
Types of Stocks: What You’ll Actually Buy
Not all stocks are created equal. Understanding the major categories helps you build a portfolio appropriate for your goals:
By Company Size (Market Cap)
- Large-cap (above $10B): Stable, well-established companies like Apple, Microsoft, JPMorgan. Lower growth potential but lower risk. Ideal for conservative investors and portfolio cores.
- Mid-cap ($2B–$10B): Companies in growth phases. More volatility than large-caps but higher growth potential.
- Small-cap (below $2B): Early-stage or niche companies. Highest potential returns but also highest risk and lower liquidity.
By Investment Style
- Growth stocks: Companies growing revenues and earnings rapidly, typically reinvesting all profits rather than paying dividends. Higher P/E ratios, higher risk, higher potential returns.
- Value stocks: Companies trading below their estimated intrinsic value — often mature businesses temporarily out of favor. Lower P/E ratios, less exciting, but historically strong long-term returns.
- Dividend stocks: Companies that return consistent cash to shareholders. Attractive for income-seeking investors; often defensive during market downturns.
- Index funds / ETFs: Not individual stocks, but funds tracking indexes. Provide instant diversification at low cost. The baseline recommendation for most beginners.
Common Beginner Mistakes to Avoid
Most of the painful lessons in stock market investing are avoidable. Here are the ones beginners make most often:
- Waiting for the “right time” to invest: Time in the market consistently beats timing the market. Research shows that investing a lump sum immediately outperforms waiting for a dip in roughly 70% of historical cases. Start now, even if conditions feel uncertain.
- Checking your portfolio daily: Daily price movements are noise. Obsessively monitoring your portfolio leads to emotional decisions and trading at exactly the wrong times. Check your portfolio monthly at most.
- Selling during market crashes: Every major market crash in history — 1987, 2000, 2008, 2020 — eventually fully recovered and went higher. Investors who sold during those crashes locked in losses and missed the recoveries. The right response to a crash is typically to hold or buy more, not sell.
- Concentrating in one stock or sector: A single stock going to zero can wipe out years of gains from other investments. Diversification isn’t just theory — it’s the main tool individual investors have to protect against being catastrophically wrong about a single company.
- Chasing hot tips and trending stocks: By the time a stock appears on Reddit or a news headline, the sophisticated investors have already positioned. Retail investors following trends typically buy at the peak of enthusiasm, just before the price falls.
Understanding Market Cycles
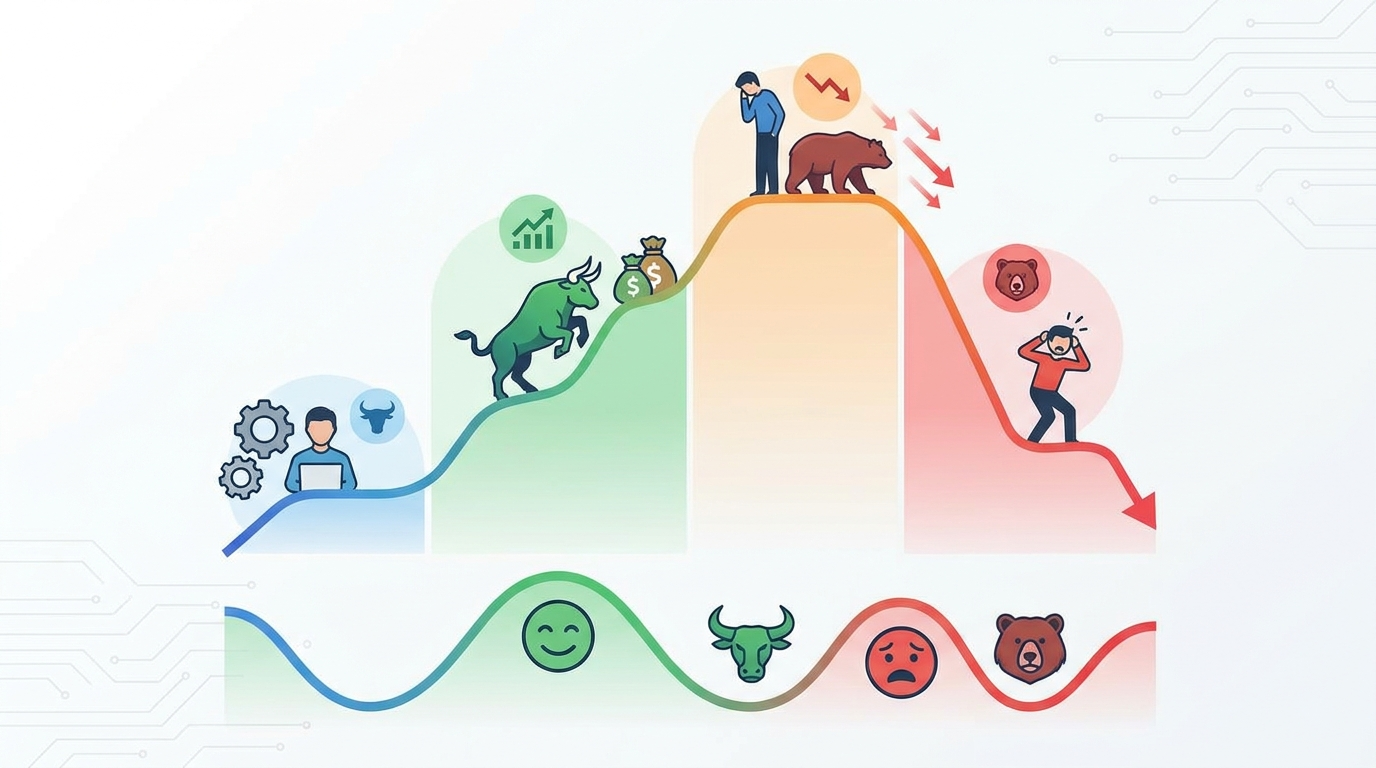
The stock market moves in cycles — alternating periods of expansion (bull markets) and contraction (bear markets). Understanding these cycles doesn’t mean you can time the market, but it does help you maintain perspective when the news is either irrationally exuberant or catastrophically pessimistic.
The Four Market Cycle Phases
- Accumulation: The cycle begins after a market bottom. Informed, long-term investors recognize undervaluation and begin buying while most of the public is still pessimistic. Prices move sideways to slightly up. Trading volume is low.
- Markup (Bull Market): Prices begin rising consistently. Optimism spreads. More investors enter the market. Media coverage turns positive. This phase can last years and produces the majority of long-term market gains.
- Distribution: Prices reach a peak as early buyers begin selling to late arrivals. The market feels most exciting and optimistic at exactly this moment. Volatility increases. Sophisticated investors reduce risk; retail investors pile in.
- Markdown (Bear Market): Prices fall 20%+ from recent highs. Fear dominates. Bad news accelerates selling. This is psychologically the most difficult phase for investors — and paradoxically, the phase that creates the best future buying opportunities.
The critical insight: the most pessimistic moments in markets are historically the best times to invest, and the most optimistic moments are when you should be most cautious. This runs directly against human psychology, which is why most retail investors underperform the market averages they could easily match with index funds.
Historical Bear Markets in Context
| Bear Market | S&P 500 Decline | Duration | Recovery to New High |
|---|---|---|---|
| Dot-com crash (2000-2002) | -49% | 2.5 years | 5 years |
| Financial crisis (2007-2009) | -57% | 1.5 years | 4 years |
| COVID crash (2020) | -34% | 33 days | 5 months |
| Inflation bear (2022) | -25% | 9 months | 18 months |
Every bear market in history ended. Every recovery exceeded the previous peak. The investors who held through the declines captured the full return; those who sold locked in permanent losses.
Tax-Advantaged Accounts: Where to Hold Your Stocks
In most countries, investment returns are taxed. The account you use to hold your investments can significantly affect your after-tax returns. In the United States, two main tax-advantaged account types are available to individual investors:
401(k) / Employer Retirement Plans
A 401(k) allows you to invest pre-tax money — reducing your taxable income today — with taxes deferred until withdrawal in retirement. Many employers match contributions up to a certain percentage. An employer match is a guaranteed 50-100% return on that portion of your investment, making it the first place every investor should direct money.
Individual Retirement Account (IRA)
A Roth IRA allows after-tax contributions, but all future growth and withdrawals are completely tax-free. For younger investors in lower tax brackets, the Roth IRA is one of the most powerful long-term investment tools available. A Traditional IRA works like a 401(k) — pre-tax contributions, taxed on withdrawal.
The general priority order for new investors:
- Contribute to 401(k) up to employer match (free money)
- Max out Roth IRA ($7,000/year as of 2024)
- Return to 401(k) up to annual limit ($23,000/year as of 2024)
- Taxable brokerage account for additional investments
Reading the Market: Basic Tools for Beginners
You don’t need to be a professional analyst to make informed investment decisions. A few basic tools provide the most useful signal:
Earnings Reports
Every public company reports earnings quarterly. The report includes revenue, earnings per share, and management guidance for future quarters. Earnings reports are the single most important recurring event that drives individual stock prices. Key things to check: did they beat or miss analyst expectations? What did management say about the next quarter? Is the trend improving or deteriorating?
The Price-to-Earnings (P/E) Ratio
The P/E ratio is the most widely used valuation metric. It shows how many dollars investors are paying per dollar of annual earnings. A P/E of 20 means you’re paying $20 for $1 of earnings. The S&P 500 average P/E has historically ranged from 10 to 25, with 15-18 considered “fair value” in most economic conditions.
The 52-Week High/Low
Every stock’s trading page shows the 52-week high (highest price in the past year) and 52-week low (lowest). This range provides quick context: a stock near its 52-week low might be undervalued — or it might be declining for good reasons. A stock near its 52-week high might be overvalued — or it might be a momentum leader worth watching. Context always matters.
Building Your First Investment Philosophy
As you learn more about investing, you’ll develop a personal investment philosophy — a clear set of principles guiding your decisions. The most important elements to define early:
- Your time horizon: Short-term investors and long-term investors should hold completely different portfolios. Be honest about when you’ll actually need your money.
- Your risk tolerance: Not abstract “how much risk can you afford” but specific “how would I respond if my portfolio dropped 40% next month?” If the honest answer is “I’d sell everything,” your allocation needs to be more conservative.
- Your strategy commitment: Pick an approach — index-first, value, dividend, growth — and commit to it through at least one full market cycle before evaluating whether to adjust. Strategy-hopping after every downturn guarantees underperformance.
- Your information diet: Limit financial news consumption. Daily market commentary is designed to keep you engaged, not to make you a better investor. Quarterly or semi-annual deep reviews of your portfolio are more valuable than daily monitoring.
The best investment philosophy is one you can stick to consistently. A theoretically optimal strategy abandoned during a crash produces worse outcomes than a slightly suboptimal strategy executed with discipline for 20 years.
How to Start Investing in the Stock Market
The mechanics of getting started are simpler than most beginners expect:
- Open a brokerage account: Fidelity, Charles Schwab, and Vanguard are the gold-standard platforms for long-term investors — low costs, good tools, excellent customer service. For active traders, platforms like Interactive Brokers offer more sophisticated tools.
- Start with index funds: Before buying individual stocks, consider allocating a core position to a total market index fund (like Vanguard’s VTI or Fidelity’s FZROX). This gives you immediate diversification while you learn.
- Define your time horizon and risk tolerance: If you need the money in 2 years, keep it in cash or bonds. If you have 20+ years, you can tolerate significant equity exposure. Being honest about your actual risk tolerance prevents panic-selling during downturns.
- Set up automatic contributions: Automate a monthly investment — even $100/month — so you invest consistently regardless of market conditions or emotional state.
- Keep learning continuously: The more you understand businesses, industries, and economic cycles, the better investment decisions you’ll make over time.
If you’re ready to take the next step, our guide on how to invest in stocks step by step covers the account setup and first purchase process in detail. And when you’re evaluating specific companies, the stock investment strategies guide will help you choose the approach that fits your goals and personality.
The stock market rewards the patient, the disciplined, and the informed. You’re already building all three by reading this.
Want to understand the mechanics behind every price move? Read our deep-dive on how the stock market works — order books, price discovery, and the invisible auction explained.
📚 P5 Deep Dive
- Stock Market Crash — what causes them, how to survive, why they create opportunity
- How to Start Investing — complete beginner action plan
- Stock Market Index — what it is, how it works, why it matters
Leave a Reply