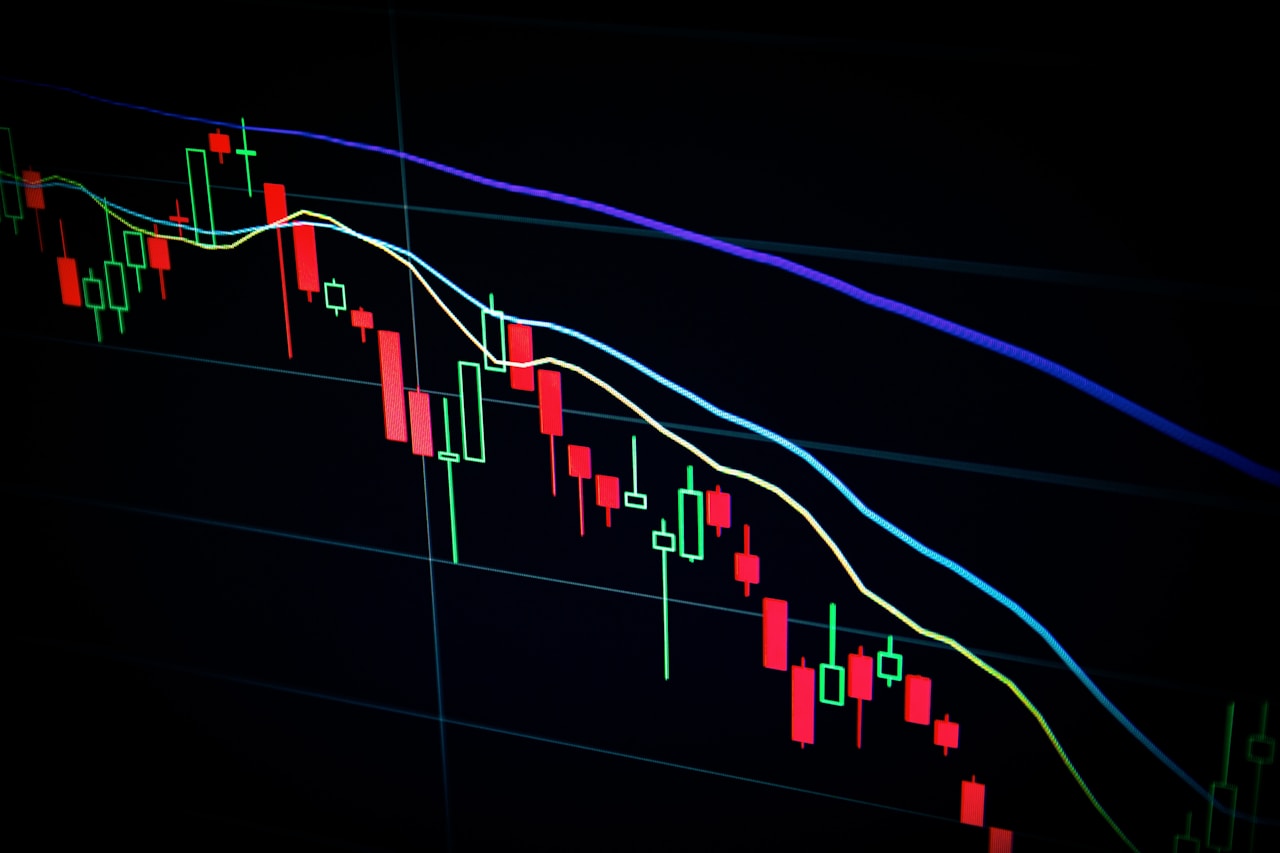
Every day, billions of dollars change hands in milliseconds across computer networks that span the globe. Share prices flicker up and down like a living organism. Fortunes shift. Companies are valued and revalued in real time. And yet most people who participate in this system have only the vaguest idea of how it actually works underneath.
That gap matters. Understanding the mechanics of how the stock market works — not just “you buy low and sell high” but the actual infrastructure, incentives, and forces at play — makes you a dramatically better investor. You stop being surprised by things that should be predictable. You start reading market behavior as information rather than noise.
The best mental model: the stock market is an invisible, continuous auction house — one that never closes, runs simultaneously across thousands of securities, and is attended by everyone from pension funds managing billions to individuals with a few hundred dollars. Your job as an investor is to understand the rules of this auction well enough to participate without being systematically exploited by those who know them better.
The Architecture: What the Stock Market Actually Is
Most people picture “the stock market” as a single place — the famous trading floor with people shouting in colored jackets. That image is largely obsolete. The modern stock market is a distributed electronic network connecting buyers, sellers, brokers, market makers, and exchanges across thousands of servers worldwide.
The Key Players
| Player | Role | How They Make Money |
|---|---|---|
| Stock Exchanges (NYSE, NASDAQ) |
Provide the platform and rules for trading | Listing fees + transaction fees |
| Brokers (Fidelity, Schwab, Robinhood) |
Route your orders to the exchange | Commissions, interest on cash, payment for order flow |
| Market Makers (Citadel, Virtu) |
Quote both buy and sell prices simultaneously, providing liquidity | Bid-ask spread captured millions of times per day |
| Institutional Investors (BlackRock, Vanguard, hedge funds) |
Large-scale buyers/sellers of securities | Fund management fees + investment returns |
| Retail Investors (individual investors) |
Buy and hold for personal wealth building | Capital appreciation + dividends |
| Regulators (SEC, FINRA) |
Enforce rules, prevent fraud, ensure fair markets | Government funded (enforcement fines) |
Understanding these players — and their incentives — clarifies a lot of seemingly mysterious market behavior. Market makers need volatility to profit. Brokers may have incentives to route your order to specific counterparties. Institutional investors move markets by their sheer size. Regulators move slowly but reshape the game over years.
The Auction in Action: Price Discovery
The core function of the stock market is price discovery — the continuous process of determining what a security is worth right now, given all available information and the current balance of supply and demand.
Here is how it happens mechanically:
The Order Book
At any moment, for any listed stock, an electronic order book maintains two lists:
- Bid side: All buyers, ranked by the highest price they’re willing to pay
- Ask side: All sellers, ranked by the lowest price they’re willing to accept
The bid-ask spread is the gap between the highest bid and the lowest ask. When these two prices match — a buyer meets a seller — a trade executes.
Example: Apple stock has a bid of $189.45 (the highest price anyone will currently pay) and an ask of $189.47 (the lowest price anyone will currently sell at). The $0.02 spread is captured by the market maker facilitating the transaction. When you place a market order, you immediately pay the ask or receive the bid — you “cross the spread.”
Types of Orders (And Why They Matter)
| Order Type | How It Works | Best Used When | Risk |
|---|---|---|---|
| Market Order | Execute immediately at the best available price | High-liquidity stocks, small position sizes | Price slippage in volatile markets |
| Limit Order | Execute only at your specified price or better | Most situations — gives price control | May not fill if price doesn’t reach your level |
| Stop-Loss Order | Triggers a market sell when price falls to specified level | Risk management, protecting gains | Can trigger during brief dips (whipsaws) |
| Stop-Limit Order | Triggers a limit sell when price hits stop level | Precise exit management | May not fill in fast-moving markets |
For most individual investors, limit orders are almost always preferable to market orders. A limit order costs you nothing extra and protects you from getting filled at a dramatically different price than expected — which can happen in less liquid stocks or during volatile market conditions.
How Stock Prices Actually Move: The Three Forces
The auction metaphor helps explain how prices are set. But why do they move? Three distinct forces drive price changes:
Force 1: Fundamental Reality Changes
When a company’s actual business performance changes, its intrinsic value changes. Better earnings → higher justified valuation → price rises. Deteriorating margins → lower justified valuation → price falls. This is the slow, grinding force that dominates over years and decades.
The key insight: fundamental changes are priced in immediately when they become public knowledge. Markets are highly efficient at incorporating new information into prices. This means that reading yesterday’s earnings report won’t help you trade today — that information is already in the price the moment trading resumes.
Force 2: Expectation Changes
More powerful in the short term than actual results are changes in expectations. A company can report record profits and still see its stock fall 15% — if those profits came in below what analysts expected. The market doesn’t price in reality; it prices in expectations of reality. The gap between expectation and outcome is what creates sharp price moves on earnings days.
This is why “buy the rumor, sell the news” is a genuine market phenomenon. If positive news has been anticipated, the price often rises before the announcement and falls afterward — not because the news was bad, but because it was already priced in.
Force 3: Liquidity and Flow
Sometimes prices move simply because large amounts of money need to enter or exit. When a pension fund rebalances, it might need to sell $500 million of equities — not because anything changed about those companies, but because of allocation targets. When retail investors panic-sell during a crash, prices fall beyond fundamental justification simply because there are more forced sellers than buyers at any given moment.
Understanding liquidity-driven moves prevents a common beginner mistake: assuming that every price movement reflects new information about company fundamentals. Often, it’s just the mechanics of who needs to buy or sell at that particular moment.
Market Hours, Pre-Market, and After-Hours Trading
The main US stock market session runs 9:30 AM to 4:00 PM Eastern Time, Monday through Friday (excluding US holidays). But trading doesn’t stop there:
| Session | Hours (ET) | Liquidity | Who Should Use |
|---|---|---|---|
| Pre-Market | 4:00 AM – 9:30 AM | Low — wide spreads, thin volume | Professionals reacting to overnight news |
| Regular Session | 9:30 AM – 4:00 PM | High — tightest spreads, most volume | All investors — best execution quality |
| Power Hour | 3:00 PM – 4:00 PM | Very high — institutional repositioning | Traders who understand end-of-day dynamics |
| After-Hours | 4:00 PM – 8:00 PM | Low — wide spreads, thin volume | Reacting to after-close earnings reports |
The opening 30 minutes (9:30–10:00 AM) and the final hour (3:00–4:00 PM) typically see the highest volume and volatility of the regular session. For most beginner investors, placing orders mid-day (10:30 AM to 2:30 PM) when spreads are tightest and volatility is lower will produce better execution than trading at the open or close.
Indexes: The Market’s Report Card
When someone says “the market was up 1.2% today,” they’re referring to a stock market index. Understanding what these indexes represent — and their limitations — prevents significant misreadings of market conditions.
How Indexes Are Constructed
The two main construction methods produce different results:
- Market-cap weighted (S&P 500, NASDAQ): Larger companies have proportionally more influence. If Apple represents 7% of the S&P 500’s total market cap, a 5% move in Apple moves the index as much as a 5% move in the bottom 50 companies combined. This means index performance can be dominated by a handful of mega-caps.
- Price-weighted (Dow Jones): Higher-priced stocks have more influence regardless of company size. A $500 stock affects the DJIA more than a $50 stock even if the $50 company is ten times larger by market cap. This methodology is outdated and a key reason why the DJIA is less useful than the S&P 500 as a market benchmark.
What Indexes Don’t Tell You
Indexes measure large-cap, publicly traded companies. They miss: private companies (SpaceX, Stripe), small businesses, real estate, commodities, and international markets. The S&P 500 being “up” doesn’t mean every stock is up — in some bull markets, the majority of individual stocks actually decline while a small number of mega-caps drive the index higher.

The Mechanics of Corporate Actions
Beyond regular buying and selling, several corporate actions affect stock prices and your position as a shareholder:
Stock Splits
A stock split increases share count while proportionally reducing price — the total value of your holding is unchanged. A 4-for-1 split means each $400 share becomes four $100 shares. Companies split stocks primarily to improve liquidity and accessibility. Apple (AAPL) has split multiple times, most recently 4-for-1 in 2020.
Dividends and Ex-Dividend Dates
When a company declares a dividend, four dates matter:
- Declaration Date: The board announces the dividend amount
- Ex-Dividend Date: You must own the stock before this date to receive the dividend
- Record Date: The company records who qualifies (typically 1 business day after ex-div)
- Payment Date: Cash is distributed to eligible shareholders
On the ex-dividend date, the stock price typically drops by approximately the dividend amount — because buyers after this date won’t receive the upcoming dividend. This is mechanical, not fundamental.
Share Buybacks
When companies repurchase their own shares, they reduce the share count. With fewer shares outstanding, each remaining share represents a larger ownership slice — earnings per share increases without earnings actually changing. Buybacks are often more tax-efficient than dividends for shareholders because they don’t trigger a taxable event unless you sell.
Market Efficiency: What It Means for You
The Efficient Market Hypothesis (EMH) is one of the most studied and debated ideas in finance. In its strongest form, it claims that all available information is instantly reflected in stock prices, making it impossible to consistently “beat the market.”
The practical implication for investors:
- Weak form efficiency: Technical analysis of past prices cannot consistently predict future prices. Confirmed by most academic research.
- Semi-strong form efficiency: Publicly available fundamental information is quickly priced in. This explains why most active fund managers underperform index funds over 15+ years.
- Strong form efficiency: Even private information is priced in. This is false — insider trading prosecutions confirm that non-public information can provide trading advantages (and is illegal for that reason).
The practical takeaway: don’t expect to consistently outperform the market based on publicly available information. The investors who beat the market long-term typically have either genuine informational edge (deep industry expertise), behavioral advantages (ability to hold through extreme volatility), or structural advantages (access to private investments unavailable to most).
The Role of Emotions in Market Mechanics
The textbook version of market mechanics assumes rational actors making efficient decisions. The real version includes the full range of human psychology amplified by crowds and media.
The Fear and Greed Cycle is the emotional engine that creates market bubbles and crashes:
- Optimism: Markets rise. Investors feel validated. Early cautioners look foolish.
- Excitement: Prices accelerate. Friends and media talk about stocks. FOMO increases.
- Euphoria: Everyone “knows” prices will keep rising. Risk feels irrelevant. This is typically the market peak.
- Anxiety: Prices begin falling. Investors tell themselves it’s temporary.
- Denial: “It’ll bounce back.” Losses mount but selling feels like accepting defeat.
- Panic: Fear dominates. Selling accelerates regardless of price. This is often near the market bottom.
- Capitulation and Depression: Investors who held finally give up and sell at the worst possible time.
- Disbelief: Prices begin recovering but investors don’t trust it — they’ve been burned.
- The cycle repeats from Optimism.
Knowing where you are in this cycle doesn’t let you time the market perfectly. But it does allow you to recognize when you’re being driven by emotion rather than analysis — and to make decisions accordingly.
Clearing and Settlement: The 48-Hour Handshake You Never See
When you click “Buy” and see your portfolio update instantly, it feels like the transaction is complete. It isn’t. The confirmation you see is just a promise. The actual transfer of ownership and cash happens through a back-office process called clearing and settlement — and understanding it explains some quirks that confuse beginner investors.
T+2 Settlement
Most US stock trades settle on a T+2 basis — meaning the transaction officially completes two business days after the trade date. If you buy stock on Monday (T), the shares are officially transferred to your account and the cash is officially transferred to the seller on Wednesday (T+2).
Why does this matter practically? A few reasons:
- Selling immediately after buying: You can see the shares in your account and sell them before settlement, but margin requirements may apply if you lack the cash balance
- Dividend eligibility: You must own stock before the ex-dividend date — which is determined by settlement, not trade date
- Cash availability: When you sell stock, the cash isn’t immediately available for withdrawal — it becomes available after T+2 settlement (though many brokers let you use unsettled funds to buy other securities)
Who Handles Clearing?
The Depository Trust & Clearing Corporation (DTCC) is the central clearing infrastructure for US markets — handling approximately $2.4 quadrillion in securities transactions annually. It acts as the central counterparty for both sides of every trade, eliminating the risk that either party defaults before settlement completes. This infrastructure is largely invisible to individual investors but is a critical piece of why markets work reliably at scale.
Short Selling: Profiting from Falling Prices
Most investors profit when prices rise. Short sellers profit when prices fall — and understanding short selling illuminates a mechanism that affects prices you’ll encounter as a long investor.
How Short Selling Works
- Short seller borrows shares from a broker (who borrows them from long-term holders)
- Short seller sells the borrowed shares at the current price
- If price falls as expected, short seller buys shares back at a lower price
- Returns borrowed shares to broker, keeps the difference (minus borrowing costs)
- If price rises instead, short seller faces unlimited theoretical losses
Short sellers play a valuable role in market efficiency — they act as a check on overvalued companies and fraud. Famous short sellers like Carson Block (Muddy Waters) and Jim Chanos have exposed accounting fraud at companies like Enron and Luckin Coffee. When a heavily shorted stock suddenly surges, short sellers must buy shares to cover — creating a short squeeze that dramatically amplifies the price move (as seen with GameStop in January 2021).
Options, Futures, and Derivatives: What They Are (And Whether You Need Them)
Beyond buying stocks outright, financial markets offer derivatives — contracts whose value is derived from an underlying asset. A brief orientation is useful even if you never trade them, because derivatives activity significantly affects the underlying stock market.
| Instrument | What It Is | Who Typically Uses It | Risk Level |
|---|---|---|---|
| Call Option | Right to buy shares at a fixed price before expiration | Speculators betting on price rise; income sellers | High (buyer can lose 100% of premium) |
| Put Option | Right to sell shares at a fixed price before expiration | Hedgers protecting against decline; speculators | High (similar to calls) |
| Futures Contract | Obligation to buy/sell an asset at a set price on a set date | Institutions, commodities producers, speculators | Very high (leveraged, obligatory) |
| ETF (Leveraged) | Fund that multiplies daily index returns (2x, 3x) | Short-term traders only | Very high (volatility decay destroys long-term value) |
For beginning and intermediate investors, the recommendation is clear: avoid derivatives until you have significant experience and a specific, well-understood reason to use them. The leverage they provide amplifies losses as reliably as gains, and most retail options traders lose money. Focus on building a solid foundation with direct stock ownership or index funds first.
Market Microstructure: Why Your Trade Gets Routed Where It Does
One piece of market mechanics that rarely gets explained to retail investors — but directly affects your returns — is payment for order flow (PFOF).
Here is what happens when you place a trade on most commission-free brokers:
- Your order goes to your broker (Robinhood, Webull, etc.)
- Instead of routing directly to an exchange, your broker sends it to a market maker (Citadel Securities, Virtu)
- The market maker pays the broker for this order flow
- The market maker fills your order, typically at a price slightly worse than the best available exchange price — but better than the quoted spread
- The market maker keeps the difference between what they paid for your order and the spread they captured
PFOF is controversial. Proponents argue retail investors still get better prices than they could execute directly. Critics argue it creates a conflict of interest: brokers are incentivized to route orders to whoever pays the most, not whoever gives you the best execution. The SEC has proposed rules requiring brokers to demonstrate “best execution” for all orders.
The practical implication: for large trades, it’s worth comparing execution quality across brokers. Fidelity and Interactive Brokers have historically shown better execution quality on large trades than commission-free apps that rely heavily on PFOF revenue.

Global Markets and How They Affect US Stocks
The stock market doesn’t operate in isolation. US equities are deeply connected to global financial systems, and understanding these linkages helps explain seemingly random price movements that have nothing to do with individual company performance.
Overnight Gaps: Why Stocks Open at Different Prices
While US markets are closed (4:00 PM to 9:30 AM ET), significant events can occur globally — Japanese economic data releases, European central bank decisions, geopolitical events, or major corporate announcements. US stock futures trade nearly 24 hours, reflecting these overnight developments. This is why stocks often open at a notably different price than where they closed the previous day: the market is “catching up” to information that developed while the regular session was closed.
Currency Effects
For multinational companies, currency fluctuations directly affect reported earnings. A strong US dollar means that revenue earned in euros, yen, or pounds converts to fewer dollars when reported. This is why US multinationals often report “constant currency” revenue growth figures alongside regular GAAP results — stripping out currency effects to show underlying business performance.
Correlation and Contagion
Global markets are increasingly correlated. A financial crisis in Europe, a growth slowdown in China, or a sovereign debt problem in emerging markets can trigger selling across US equities even when US economic fundamentals are healthy. This “contagion” effect is driven by institutional investors managing global portfolios who sell liquid US assets to cover losses elsewhere, and by the general risk-off sentiment that spreads when global financial stability is threatened.
For long-term investors, these international contagion events are typically buying opportunities rather than signals of fundamental US deterioration. The 2011 European debt crisis, for example, caused significant US stock market volatility despite US corporate earnings remaining strong throughout — and was followed by one of the longest bull markets in US history.
Ready to Apply This Knowledge?
Start Your Investment Journey Today
You now understand the mechanics behind every trade. The next step is putting that knowledge to work with a clear strategy and your first investment.
Putting It All Together: What Smart Investors Do Differently
Understanding market mechanics changes how you act in three concrete ways:
1. You use limit orders, not market orders. You know the order book exists and that market orders cross the spread unnecessarily in most situations. Limit orders cost nothing and improve your execution price.
2. You ignore short-term price movements. You understand that most daily fluctuations are noise — liquidity flows, sentiment shifts, and random variation rather than new information about business fundamentals. Long-term investors who understand this check their portfolios monthly, not daily.
3. You buy when others panic. You recognize the Fear and Greed Cycle for what it is. When markets are in panic and fear is peaking, you know from history that this is often the best time to invest more — not to sell. The counterintuitive action is usually the correct one.
The stock market rewards those who understand it. That understanding starts exactly here — with the mechanics of how prices are set, how trades execute, and how human psychology shapes everything in between.
For the full picture on getting started, read our guides on what stock investment is and our complete beginner’s guide to the stock market.
Leave a Reply