
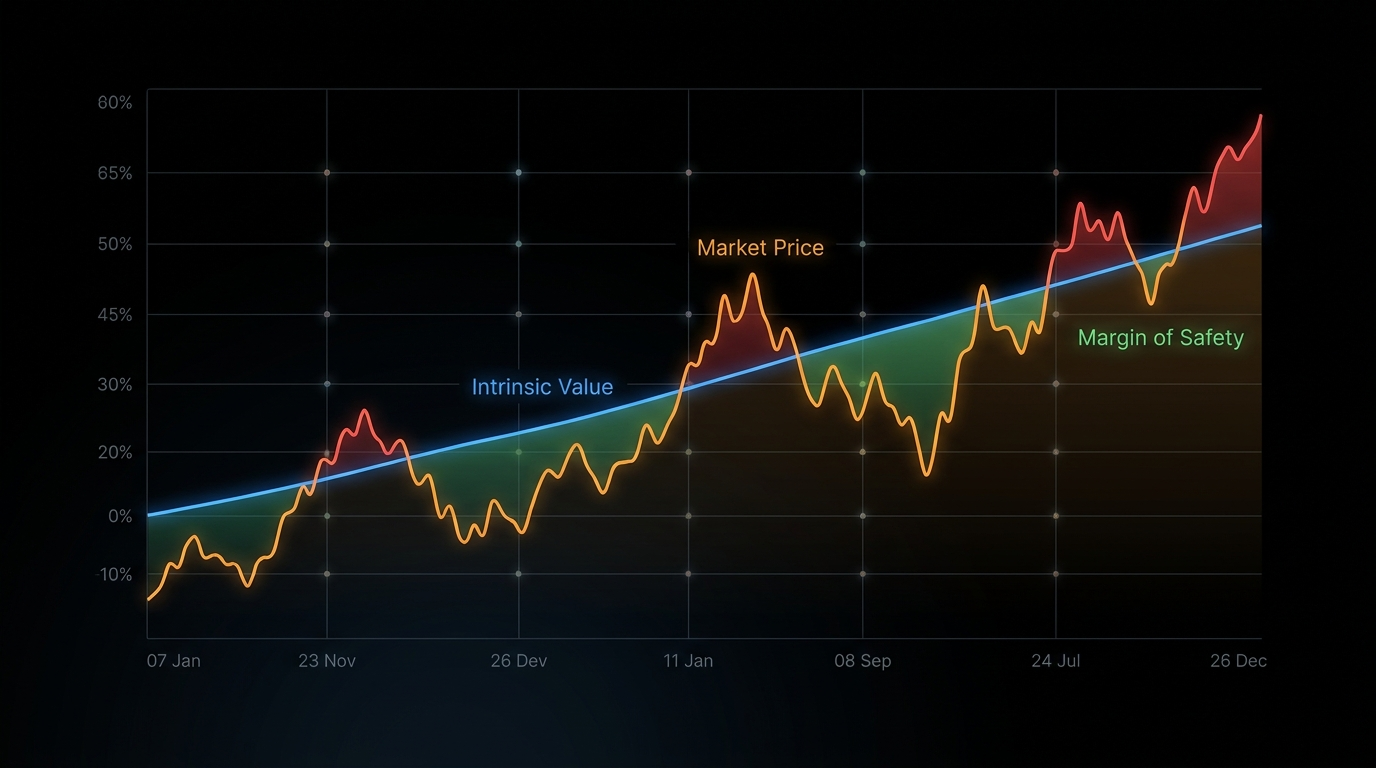
Every great investment has one thing in common: the price paid was lower than what the asset was actually worth. That gap — between price and value — is the entire foundation of finding undervalued stocks.
The concept sounds simple. The execution is where most investors struggle. Markets are reasonably efficient most of the time, which means obvious bargains are rare and quickly arbitraged away. But markets are also driven by emotion, narrative, and short-term thinking — which creates persistent mispricings for investors patient enough to look past the noise.
This guide covers four proven methods for identifying stocks trading below intrinsic value, how to distinguish a genuine bargain from a value trap, and the mental framework that separates successful value hunters from investors who buy cheap stocks that get cheaper.
What Makes a Stock “Undervalued”?
A stock is undervalued when its current market price is lower than the present value of the future cash flows the underlying business will generate. This is the core definition — and it immediately tells you that “undervalued” is not about a stock’s price in isolation.
A $5 stock is not inherently cheap. A $500 stock is not inherently expensive. Price alone means nothing. What matters is what you get for that price — the quality and predictability of the earnings, cash flows, and assets backing it.
Common reasons stocks become undervalued:
- Temporary bad news — A missed earnings quarter, a product recall, a management departure. Markets often overreact to short-term events in businesses with long-term durable fundamentals.
- Sector rotation — Investors collectively move away from certain industries (energy, banks, utilities) regardless of individual company fundamentals, creating bargains for those willing to look.
- Complexity discount — Businesses with convoluted structures (holding companies, conglomerates, spinoffs) are often ignored by analysts, leaving them mispriced by the market.
- Small cap neglect — Smaller companies receive less analyst coverage, creating more room for mispricings that diligent individual investors can exploit.
- Market-wide panic — Broad sell-offs (2008, 2020, 2022) push even high-quality businesses to temporarily irrational prices.
The 4 Methods for Finding Undervalued Stocks
Method 1: The Earnings-Based Screen (P/E and PEG)
The price-to-earnings (P/E) ratio is the most widely used valuation metric — and the most frequently misused. The right way to use P/E is not to find stocks with “low numbers,” but to find stocks whose P/E is low relative to their earnings quality and growth rate.
How to apply P/E correctly:
- Compare P/E to the company’s own 5-year historical average — is it trading at a discount to its own history?
- Compare P/E to sector peers — is it cheaper than comparable businesses for a reason that’s temporary or structural?
- Use the PEG ratio (P/E ÷ earnings growth rate) to adjust for growth. A PEG below 1.0 often signals undervaluation; above 2.0 signals potential overvaluation.
| Metric | Formula | Undervalue Signal | Watch Out For |
|---|---|---|---|
| P/E Ratio | Price ÷ EPS | Below sector average + company history | Cyclical earnings can make P/E look misleadingly low at peaks |
| Forward P/E | Price ÷ Next Year EPS estimate | Below 15× for stable businesses | Estimates can be wrong — verify revenue trends |
| PEG Ratio | P/E ÷ 5-year EPS growth rate | Below 1.0 | Growth projections can be overly optimistic |
| Normalized P/E | Price ÷ 10-year average EPS | Below historical norms for that sector | Best for cyclical industries to smooth out peaks/troughs |
Method 2: The Asset-Based Screen (P/B and NAV)
Price-to-book (P/B) compares a stock’s market price to the net asset value (book value) on the company’s balance sheet. When P/B falls below 1.0, you’re theoretically paying less than the liquidation value of the company’s assets.
When P/B is most useful:
- Banks and financial institutions (assets are primarily financial, book value is meaningful)
- Real estate companies and REITs (property values can be estimated independently)
- Industrial and manufacturing companies with significant tangible assets
When P/B is less useful:
- Technology and software companies (most value is in intangibles: patents, brand, code — not on the balance sheet)
- Service businesses where people are the primary asset
The Net-Net Screen (Benjamin Graham’s Method)
Graham’s classic approach looked for stocks trading below “net current asset value” — current assets minus all liabilities. If you could buy a business for less than its working capital (cash, receivables, inventory) with zero value assigned to fixed assets, you had a margin of safety even in a worst-case scenario.
True net-nets are extremely rare today in major markets. But the principle — demanding a substantial discount to tangible asset value — remains sound, particularly in small-cap and international markets.
Method 3: The Cash Flow-Based Screen (P/FCF and EV/EBITDA)
Free cash flow is the lifeblood of a business — it’s what remains after maintaining and growing operations. Unlike earnings, free cash flow is harder to manipulate through accounting choices. P/FCF (price-to-free-cash-flow) and EV/EBITDA are therefore often more reliable signals of undervaluation than P/E alone.
P/FCF: Divide the stock price by free cash flow per share. A P/FCF below 15× in most sectors suggests reasonable value; below 12× often signals undervaluation relative to cash generation.
EV/EBITDA: Enterprise Value ÷ EBITDA. EV accounts for debt and cash, making it a better apples-to-apples comparison across companies with different capital structures. Below 8–10× is often considered undervalued for stable businesses.
FCF Yield: The inverse of P/FCF (FCF per share ÷ stock price × 100). An FCF yield above 6–8% in a low-interest-rate environment is compelling; it means the business generates real cash equivalent to 6–8% of your investment annually before any price appreciation.
Method 4: The Dividend Yield Signal
For established dividend-paying companies, yield can serve as a valuation proxy. When a stock’s dividend yield is significantly above its historical average, it often indicates the price has fallen more than the business fundamentals justify.
The logic: if a company pays $2/share annually and the stock falls from $50 (4% yield) to $35 (5.7% yield), one of two things is true: either the business has genuinely deteriorated, or the market has overreacted to temporary concerns. Distinguishing between the two is the research task.
Dividend yield signals work best for: Utilities, consumer staples, financials, and REITs — sectors with predictable, regulated, or structurally stable cash flows where management has a long-term commitment to the dividend.
For a deeper dive into dividend-based investing, see our guide on dividend investing.

The Value Trap: How to Avoid Buying a Cheap Stock That Gets Cheaper
The most dangerous concept in value investing is the value trap — a stock that looks cheap by every metric but continues to fall (or stays flat for years) because the underlying business is in structural decline.
Classic value traps share several characteristics:
- Industry in secular decline — Print media, legacy retail, traditional telecoms. Low P/E can persist for years as earnings gradually erode.
- Competitive advantage has eroded — What was once a moat has been bridged. The “cheap” valuation reflects a market that recognizes the deterioration before the investor does.
- Debt is high relative to declining cash flows — A leveraged balance sheet amplifies the damage when business conditions worsen.
- Management is in denial — Earnings calls emphasize “challenging environment” rather than addressing structural problems with a credible plan.
The key question that separates undervalued from value trap:
Is the business worth less intrinsically, or has the market temporarily mispriced a fundamentally sound business?
Temporary mispricings recover when the cause of the sell-off resolves. Structural deterioration doesn’t recover — it just gets incrementally worse as the moat widens against the company.
A Practical Screening Workflow for Undervalued Stocks
Step 1: Quantitative Screen
Use a stock screener (Finviz, Simply Wall St., or your broker) with these filters:
- P/E below sector median
- P/FCF below 20×
- EV/EBITDA below 10×
- Positive free cash flow for last 3 years
- Debt-to-equity below 1.5
- ROE above 12% (quality filter — ensures low price isn’t due to poor profitability)
Step 2: Catalyst Check
For each stock that passes the screen, identify: why is this cheap, and what could change the market’s perception?
Without a credible catalyst — an upcoming product launch, a cyclical recovery, a management change, a spinoff or restructuring — cheap stocks can stay cheap indefinitely. A catalyst doesn’t need to be imminent, but it should be identifiable.
Step 3: Intrinsic Value Estimate
Run a conservative DCF (discounted cash flow) or comparable company analysis to estimate what the business is actually worth. Build in a margin of safety — buy only when the stock is trading at least 20–30% below your intrinsic value estimate.
Step 4: Thesis Documentation
Write down your investment thesis in 3–5 sentences: why you think the stock is undervalued, what the catalyst for re-rating is, and what would make you wrong. This discipline prevents emotional decision-making later — either anchoring to a losing position or selling a winning one prematurely.
Where to Find Undervalued Stocks
Beyond screeners, several sources consistently surface overlooked or mispriced opportunities:
- 52-week low lists — Stocks near 52-week lows have often been through institutional selling. Some are value traps; others are overreactions to temporary news.
- Recent spinoffs — When a conglomerate spins off a division, institutional investors often automatically sell the new entity (it doesn’t fit their mandate). This forced selling creates temporary mispricings.
- Insider buying activity — SEC Form 4 filings show when executives buy their own stock in the open market. Multiple insiders buying during a price decline is a meaningful signal.
- Neglected sectors — Sectors that have underperformed for 2–3 years accumulate bargains as investors rotate away. Energy in 2020, financials in 2023, and consumer staples in 2024 all offered opportunities after extended periods of underperformance.
Undervalued Stock Metrics at a Glance
| Method | Primary Metric | Signal Level | Best For |
|---|---|---|---|
| Earnings-based | P/E, PEG | P/E below sector; PEG below 1.0 | Stable, profitable businesses |
| Asset-based | P/B, P/NAV | P/B below 1.5× for non-tech | Financials, industrials, real estate |
| Cash flow-based | P/FCF, EV/EBITDA | P/FCF below 15×; EV/EBITDA below 10× | Most sectors; especially capital-light |
| Yield-based | Dividend yield vs history | Yield significantly above 5-year average | Utilities, consumer staples, REITs, banks |
Common Questions About Undervalued Stocks
How long does it take for an undervalued stock to recover?
There’s no fixed timeline — this is one of the hardest aspects of value investing. Some mispricings resolve in months; others take 2–3 years. Keynes’ observation that markets can stay irrational longer than you can stay solvent is a real risk. This is why position sizing and patience are essential, and why buying near a catalyst (rather than purely on cheapness) improves outcomes.
Are there always undervalued stocks in the market?
In a bull market with high valuations, genuine bargains are rare. In corrections and bear markets, they’re widespread. The best times to build a position in undervalued stocks are precisely the times when fear is highest — which requires emotional discipline most investors struggle with.
Is a low P/E ratio enough to identify undervalued stocks?
No. P/E alone is one of the least reliable valuation signals in isolation. Low P/E stocks can reflect poor earnings quality, cyclical peak earnings about to decline, or structural business deterioration. Always combine P/E with FCF analysis, balance sheet quality checks, and a qualitative assessment of business durability.
What’s the difference between undervalued and cheap?
“Cheap” refers to price. “Undervalued” refers to the relationship between price and intrinsic value. A $3 penny stock can be expensive if it’s worth $0.50. A $1,000 stock can be cheap if it’s worth $1,500. The language matters — train yourself to always think in terms of value relative to price, not price in isolation.
For a comprehensive framework on selecting the best individual stocks, see our pillar guide on best stocks to invest in. And if you’re evaluating stocks using a quantitative picking process, our guide on how to pick stocks covers the full 5-step methodology.
📚 Continue Your Stock Selection Journey
- Best Stocks to Invest In — the 5-Factor Framework for selection
- How to Pick Stocks — step-by-step research process
- Blue Chip Stocks — why established companies anchor smart portfolios
Leave a Reply