Category: Uncategorized

  • Dollar-Cost Averaging: The Set-and-Forget Strategy That Beats Most Active Investors

    Dollar-Cost Averaging: The Set-and-Forget Strategy That Beats Most Active Investors

    What if the best investment strategy in the world required zero skill, zero market knowledge, and only 10 minutes to set up โ€” then ran on autopilot forever? That strategy exists. It’s called dollar-cost averaging. And the fact that it consistently outperforms most active traders isn’t a secret โ€” it’s just widely ignored.

    This guide explains exactly what dollar-cost averaging is, the math that makes it work, when it beats lump-sum investing, when it doesn’t, and how to implement it in a way that actually compounds wealth over decades โ€” not just sounds good in theory.

    ๐Ÿ’ก What Is Dollar-Cost Averaging?

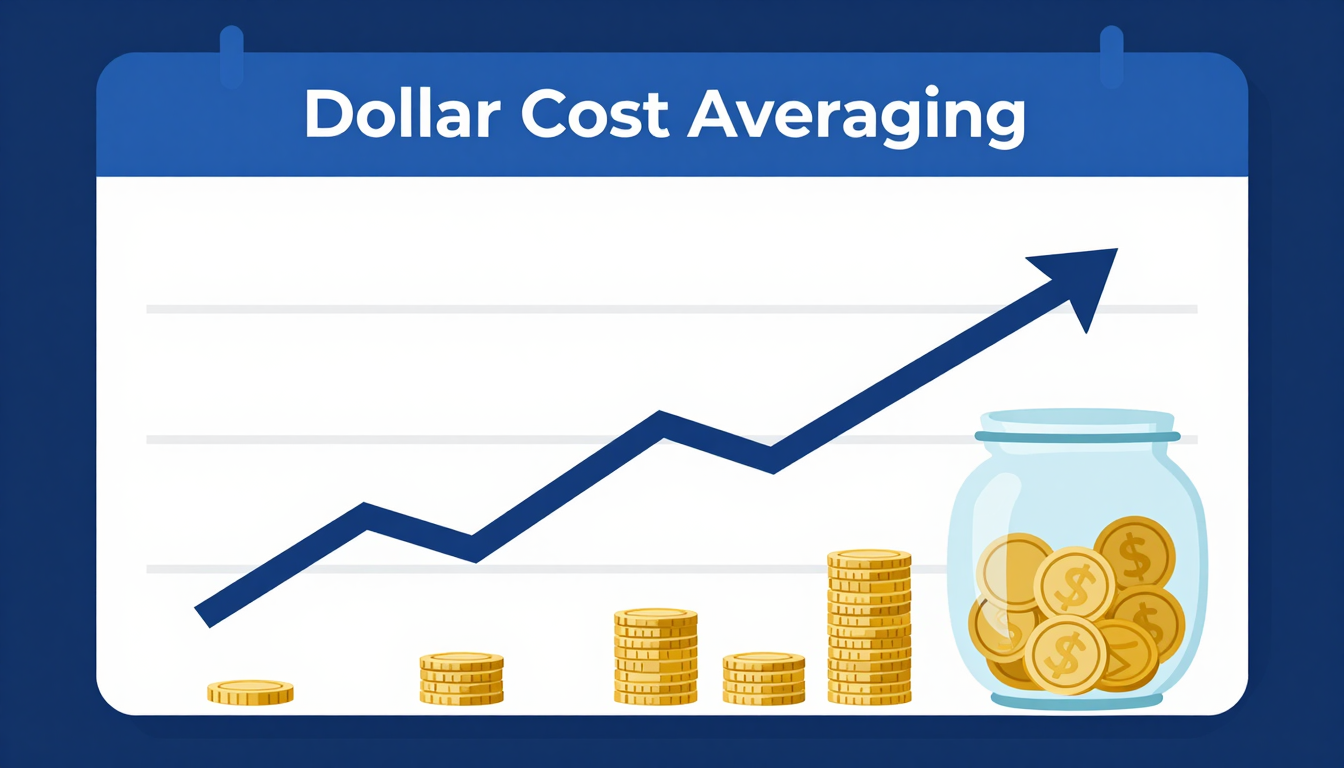
    Dollar-cost averaging (DCA) is an investment strategy where you invest a fixed dollar amount at regular intervals โ€” weekly, monthly, quarterly โ€” regardless of what the market is doing.

    You don’t wait for the “right moment.” You don’t try to buy dips or avoid peaks. You invest your $200 (or $500, or $2,000) on the same schedule, every period, rain or shine, bull market or crash. The amount is fixed. The schedule is fixed. The execution is automatic.

    What changes is how many shares you get. When prices are low, your fixed amount buys more shares. When prices are high, it buys fewer. Over time, this natural mechanism means your average cost per share trends below the market’s average price โ€” which is the mathematical edge that makes DCA so powerful for long-term investors.

    ๐Ÿงฎ The Math That Makes DCA Work

    The core insight behind DCA is a mathematical property called the harmonic mean. When you invest a fixed dollar amount at varying prices, your average cost per share is always lower than the simple average of the prices you paid at.

    Here’s a concrete example. Imagine investing $300/month in an ETF over 4 months at these prices:

    • Month 1: Price = $50 โ†’ $300 buys 6.0 shares
    • Month 2: Price = $40 โ†’ $300 buys 7.5 shares
    • Month 3: Price = $30 โ†’ $300 buys 10.0 shares
    • Month 4: Price = $60 โ†’ $300 buys 5.0 shares

    Total invested: $1,200. Total shares: 28.5. Your actual average cost per share: $1,200 รท 28.5 = $42.11

    Simple average of the four prices: ($50 + $40 + $30 + $60) รท 4 = $45.00

    Your DCA cost ($42.11) is $2.89 lower per share than the simple average. On 28.5 shares, that’s $82 in extra value โ€” from the math alone, with no skill required.

    This isn’t luck. It’s structural. Because you invested more dollars when prices were low (Month 3: 10 shares for $300) and fewer dollars when prices were high (Month 4: 5 shares for $300), your portfolio naturally accumulates more shares at lower prices.

    ๐Ÿ“… Why Regular Investing Beats Market Timing

    The alternative to DCA is trying to time the market โ€” waiting until prices look “right” before investing. This sounds logical. In practice, it fails consistently.

    The data is unambiguous:

    • A 2020 Schwab study found that even the worst possible market timer โ€” someone who invested their lump sum at the highest point of every year โ€” still dramatically outperformed someone who never invested and kept cash
    • Missing just the 10 best trading days in the S&P 500 over a 20-year period reduced returns by more than half
    • Those 10 best days almost always occur during or immediately after the worst crashes โ€” exactly when market timers are on the sidelines

    The fundamental problem with market timing: it requires being right twice โ€” when to get out AND when to get back in. Professional fund managers with entire research teams and real-time data fail at this consistently. Individual investors, operating on emotion and part-time attention, fail even more reliably.

    DCA sidesteps the entire problem. You’re not trying to predict markets. You’re systematically accumulating ownership in great companies regardless of short-term price movements. Time in the market beats timing the market โ€” and DCA is the mechanism that keeps you in the market, always.

    ๐Ÿป DCA’s Superpower: Market Crashes Become Your Friend

    This is the most counterintuitive โ€” and most powerful โ€” aspect of dollar-cost averaging.

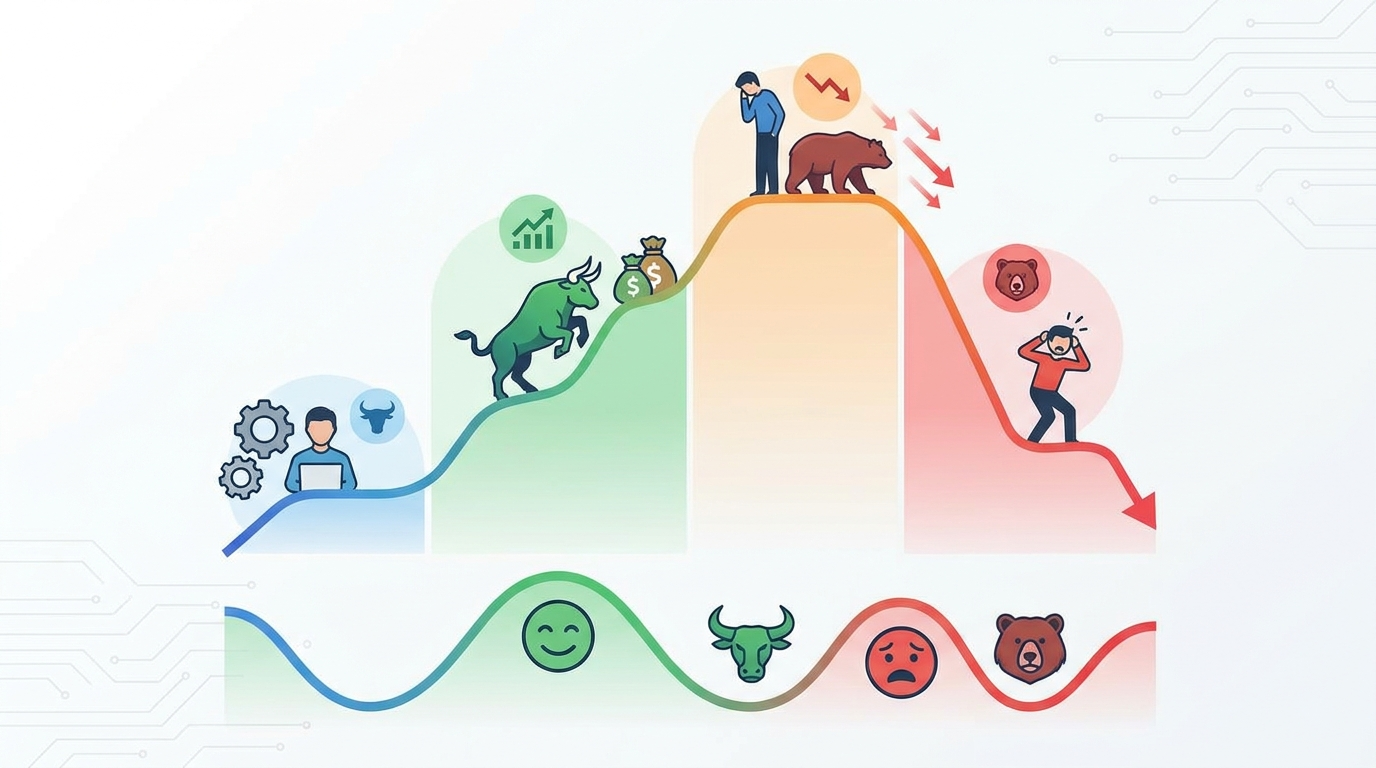
    When the market crashes 30% and your portfolio value drops, most investors panic. But for a committed DCA investor, a crash is a sale event. Your fixed monthly investment now buys significantly more shares at cheaper prices. The lower the price falls, the more ownership you accumulate with each contribution.

    Consider two investors, both putting $500/month into a broad market ETF:

    Investor A (Panic seller): Market crashes 40%. Stops contributions. Waits for recovery. Misses the bottom. Resumes investing after prices have recovered 50%. Bought almost nothing at the lows.

    Investor B (DCA disciplined): Market crashes 40%. Continues $500/month contributions without change. Accumulates 67% more shares at the bottom compared to pre-crash prices. When market recovers, each of those cheap shares contributes to larger gains.

    The 2008โ€“2009 financial crisis illustrated this perfectly. Investors who kept contributing through the bottom of March 2009 accumulated massive positions in the best companies at their lowest prices in years. The subsequent decade-long bull market multiplied those positions enormously. The investors who stopped contributing missed the most valuable accumulation window in a generation.

    Volatility โ€” which most investors fear โ€” is the mechanism that makes DCA work. Without price fluctuation, the harmonic mean advantage disappears. Paradoxically, more volatile markets often produce better DCA outcomes for patient, disciplined investors than smooth upward trends do.

    ๐Ÿ’ฐ DCA vs. Lump-Sum Investing: The Honest Comparison

    Here’s where intellectual honesty matters. DCA isn’t always mathematically optimal โ€” and understanding when it is and isn’t changes how you use it.

    When Lump-Sum Beats DCA

    Multiple studies โ€” including research from Vanguard โ€” have found that in approximately two-thirds of historical periods, investing a lump sum immediately outperforms spreading that same money through DCA over 12 months. The reason: markets go up more often than they go down. If you have $12,000 to invest and markets rise 15% over the next year, the $12,000 invested immediately grows more than $1,000/month invested throughout the year.

    If you have a large amount of cash available right now and a long time horizon, the mathematically optimal strategy is often to invest it all immediately.

    When DCA Wins

    DCA genuinely wins in these circumstances:

    • You don’t have a lump sum: You earn income monthly and invest as you earn. DCA isn’t a choice โ€” it’s the only practical option. For most working people, this is the reality.
    • Volatile or declining markets: When markets are falling or highly volatile, DCA systematically accumulates more shares at lower prices, often producing better outcomes than a lump sum invested before the decline.
    • Psychological sustainability: The “mathematically optimal” strategy that causes you to panic-sell during a crash produces terrible real-world returns. DCA’s smaller, regular contributions reduce the psychological weight of each investment decision โ€” making it far easier to stay disciplined through turbulence. A strategy you can actually stick to beats an optimal strategy you’ll abandon under pressure.
    • Uncertain timing: If you’re worried markets are overvalued but still want to invest, DCA lets you participate while reducing the risk of a single large purchase at a market peak.

    The Bottom Line

    For most people with regular income who invest monthly, DCA isn’t a choice between strategies โ€” it’s simply the practical implementation of investing consistently. The academic debate about lump sum vs. DCA matters primarily for people who receive windfalls (inheritance, bonus, asset sale proceeds). For everyone else: automate monthly investments and focus on contribution amount and asset allocation rather than timing.
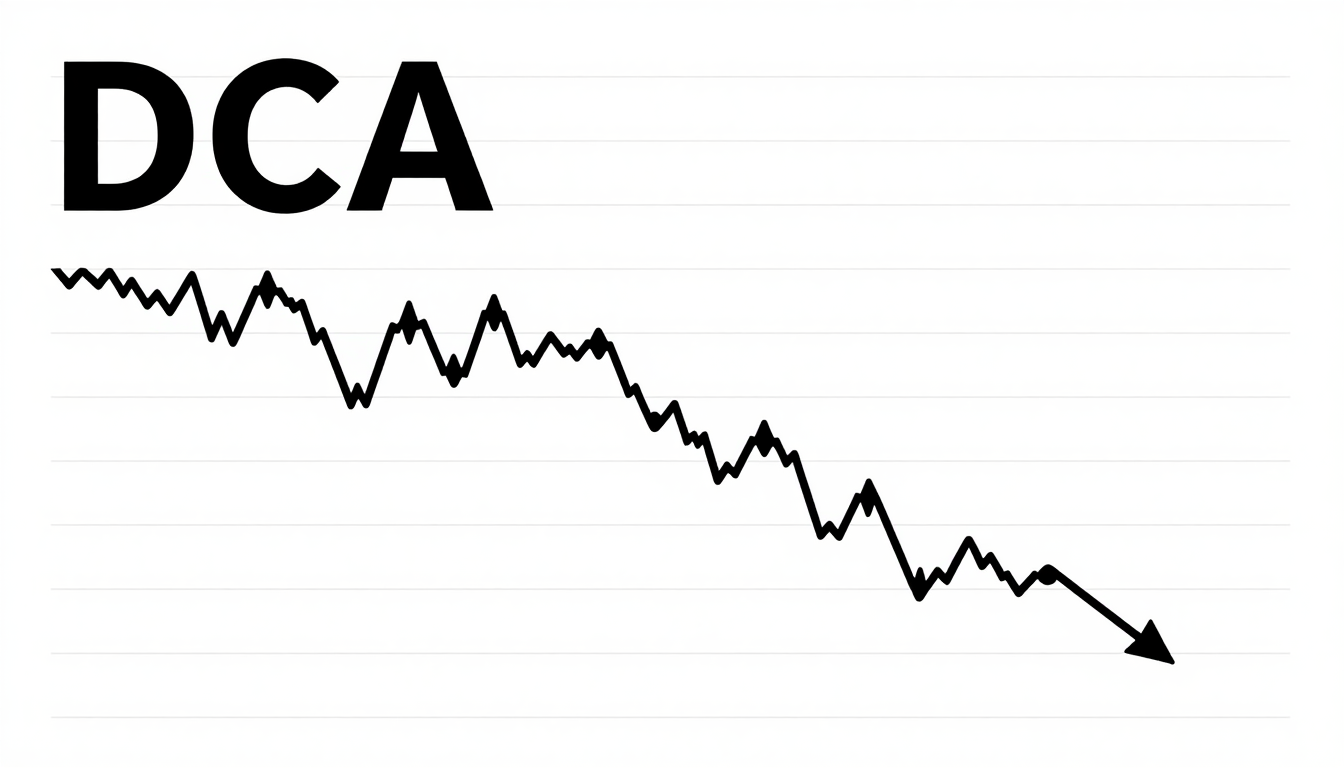
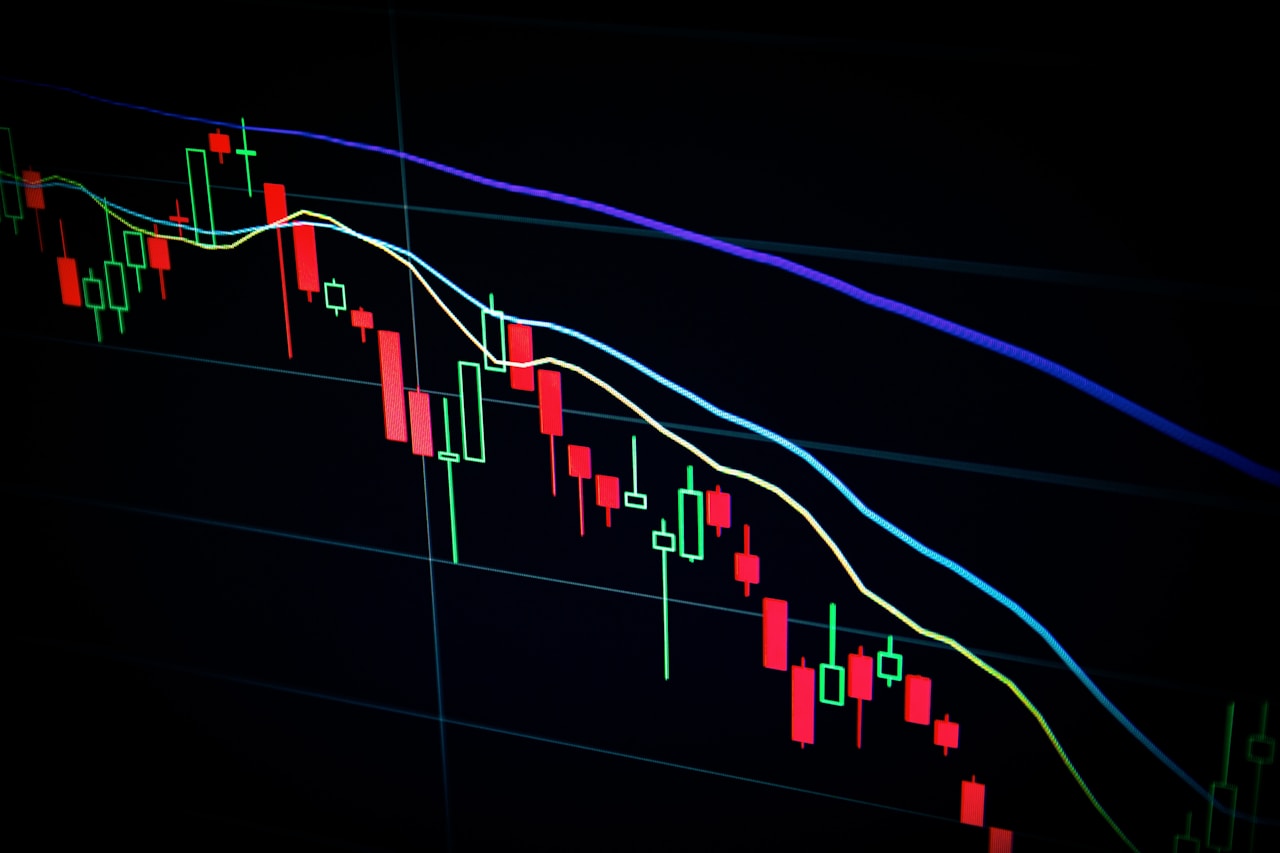
    Dollar cost averaging buy points on a stock chart

    โš™๏ธ How to Set Up Dollar-Cost Averaging (Step by Step)

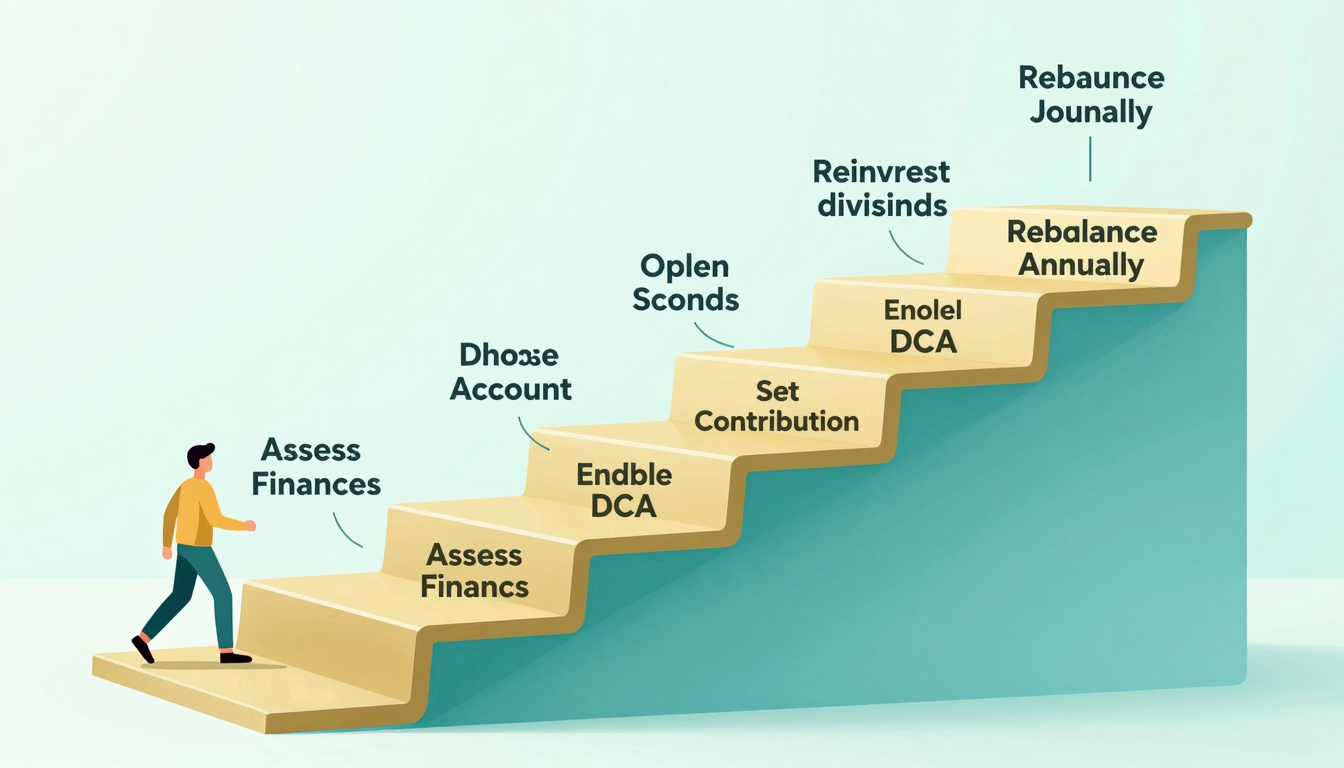
    The tactical setup is straightforward. Here’s exactly how to implement DCA:

    Step 1: Choose Your Investment Vehicle

    DCA works best with broad, diversified, liquid investments:

    • ๐ŸŒ Broad market ETFs: VTI (total US market), VOO (S&P 500), VT (total world market) โ€” instant diversification, low costs, perfectly suited for DCA
    • ๐Ÿฆ Index mutual funds: Same concept as ETFs, sometimes with automatic investment features built in at the fund level
    • ๐ŸŽฏ Target-date funds: All-in-one funds that automatically adjust stock/bond allocation as you approach a target retirement date

    Avoid using DCA on individual stocks unless you have high conviction and a robust understanding of the company. The diversification of broad ETFs makes DCA far more effective โ€” a single company can fail permanently; the broad market never has.

    Step 2: Determine Your Contribution Amount

    This is more important than which ETF you choose. Set an amount that:

    • You can consistently contribute without financial stress in any month
    • Leaves your emergency fund (3โ€“6 months expenses) intact and untouched
    • Reflects an amount you can increase annually as your income grows

    Starting with $100/month consistently beats starting with $500/month inconsistently. The discipline matters more than the initial amount.

    Step 3: Choose Your Interval

    Monthly is the most common and practical schedule for most investors โ€” aligning with paycheck cycles and eliminating decision fatigue. Weekly contributions provide slightly better mathematical DCA benefit (more price points, smoother averaging) but at the cost of more transactions and complexity. Biweekly (every two weeks, aligned to paychecks) is an excellent compromise.

    Step 4: Automate Everything

    This is non-negotiable. Set up automatic investments through your brokerage:

    • Fidelity: Automatic Investments feature โ†’ select ETF โ†’ set dollar amount โ†’ choose frequency
    • Schwab: Automatic Investing โ†’ configure recurring purchases
    • Vanguard: Automatic Investment Plan โ†’ available for Vanguard funds

    Once automated, the investment happens without any action from you. You don’t need to log in. You don’t need to think about it. You don’t need willpower during market crashes. The system executes regardless of headlines, emotions, or market conditions.

    Step 5: Revisit Annually

    Once per year: review your contribution amount and increase it if your income has grown. Rebalance your portfolio back to target allocations if significant drift has occurred. Beyond that annual review, the optimal DCA approach is benign neglect โ€” set it and let compounding do the work.

    ๐Ÿ›๏ธ DCA Inside Tax-Advantaged Accounts

    Dollar-cost averaging is most powerful when implemented inside tax-advantaged accounts:

    401(k) contributions: If you contribute a percentage of each paycheck to your 401(k), you’re already DCA-ing automatically. Your contribution goes in each payday regardless of market conditions. This is one of the best financial behaviors you can establish โ€” and most people already have it set up without realizing it’s a deliberate investment strategy.

    Roth IRA: $7,000 annual contribution limit (2024). Spreading contributions monthly ($583/month) rather than depositing the full $7,000 in January implements DCA and avoids timing risk. Contributions grow completely tax-free โ€” DCA’s compounding advantage is amplified without tax drag on gains.

    Traditional IRA: Same contribution limits as Roth IRA. Tax deduction on contributions (subject to income limits). Same DCA implementation applies.

    The combination of DCA’s mechanical advantage, tax-free compounding inside retirement accounts, and the behavioral benefit of automation creates one of the most reliable wealth-building systems available to individual investors. For a complete guide to how stock investing fits into long-term wealth building, see our pillar resource on what stock investment really means.

    ๐Ÿง  The Psychology of DCA: Why It Works When Nothing Else Does

    Finance theory often ignores human psychology. DCA accounts for it explicitly โ€” and that’s a large part of why it works in the real world when theoretically superior strategies fail in practice.

    Decision fatigue elimination: Every investment decision is a cognitive load. DCA reduces hundreds of individual decisions to one setup decision that governs all future contributions. Your mental bandwidth is freed for other things.

    Emotional detachment from short-term prices: Once you automate DCA, day-to-day or month-to-month market movements become irrelevant to your process. The check goes in on schedule. You stop obsessing over whether “now is a good time” โ€” because you’ve pre-decided that every time is a good time within your long-term strategy.

    Reduced regret risk: The most paralyzing investment fear is deploying a large sum and watching it immediately fall 20%. DCA spreads this risk across many smaller decisions. If the market drops 20% after your monthly contribution, you’ve lost on one month’s amount โ€” not your entire available capital.

    Behavioral alignment with reality: Most people don’t receive lump sums โ€” they earn regular income. DCA matches investment behavior to income timing, making it the natural, sustainable approach for the vast majority of investors throughout their working lives.

    โšก Start Investing Automatically

    Set It. Forget It. Watch It Compound.

    DCA works best when it’s automatic. Open your account, set your monthly contribution, and let time do the heavy lifting โ€” no market expertise required.

    โ“ Frequently Asked Questions

    Can I DCA with any amount?

    Yes. Fractional shares (available at Fidelity, Schwab, Robinhood, and others) let you invest any dollar amount โ€” $25, $50, $100 โ€” in any stock or ETF regardless of the share price. There’s no practical minimum for DCA with a modern brokerage account.

    Should I DCA into individual stocks or ETFs?

    ETFs are far better suited for DCA. A broad market ETF like VTI represents thousands of companies โ€” if any individual company within the ETF fails, your portfolio barely flinches. DCA into a single company stock works fine if you have high conviction, but you’re concentrating risk in a way that ETF DCA eliminates. For most investors: DCA into broad ETFs for the core portfolio, with individual stock exposure (if desired) limited to a smaller satellite allocation.

    What if I miss a month?

    Life happens. Missing one or two monthly contributions has negligible long-term impact. The important thing is resuming immediately. Don’t try to “make up” missed contributions by investing a larger lump sum โ€” that reintroduces timing risk. Just return to your regular schedule and continue.

    Should I stop DCA during a market crash?

    The opposite โ€” continue DCA through market crashes, and consider temporarily increasing contributions if your financial situation allows. Crashes are the periods when DCA accumulates the most shares at the lowest prices. Stopping contributions during downturns eliminates DCA’s primary benefit and locks in the worst possible outcome: high average cost, low share count.

    How is DCA different from a savings plan?

    A savings plan deposits money into a cash account (savings, money market) where it earns fixed interest. DCA invests in market assets (stocks, ETFs) that carry risk but provide significantly higher expected long-term returns. DCA involves real investment risk โ€” your balance fluctuates with market prices. Unlike savings, DCA positions aren’t FDIC-insured and can lose value. The trade-off: historical long-term returns from DCA into broad stock ETFs have dramatically exceeded savings account returns over any 10+ year period.

    โœ… Key Takeaways

    • ๐Ÿ”น DCA = fixed dollar amount invested at regular intervals, regardless of market conditions
    • ๐Ÿ”น The harmonic mean math ensures your average cost per share is always below the average price โ€” a structural, skill-free advantage
    • ๐Ÿ”น Market crashes become accumulation opportunities, not disasters โ€” DCA buys more shares when prices are low
    • ๐Ÿ”น Lump-sum investing is theoretically optimal when markets rise โ€” but DCA wins on psychology, practicality, and volatile markets
    • ๐Ÿ”น Automate contributions so execution doesn’t require willpower
    • ๐Ÿ”น Works best in broad market ETFs inside tax-advantaged accounts
    • ๐Ÿ”น Annual review of contribution amount is the only active management required
    • ๐Ÿ”น The best DCA investor is a boring one โ€” consistent, automatic, emotionally detached from short-term noise

    The most powerful wealth-building strategies are almost always the simplest. Dollar-cost averaging requires no market expertise, no prediction, no perfect timing. Just consistency, automation, and time. Those three ingredients, combined with broad market exposure, have built more middle-class wealth than any other investment approach in history.

    ๐Ÿ“Š Real-World DCA Scenarios: What the Numbers Look Like

    Theory is convincing. Numbers are more convincing. Here’s what consistent DCA actually produces over different time horizons, assuming an average annual return of 8% (conservative estimate for a broad US stock market ETF after inflation adjustment):

    $200/Month for 10 Years

    Total contributions: $24,000. Portfolio value at 8% average annual return: approximately $36,590. That’s $12,590 in investment gains โ€” more than 50% above your total contributions โ€” generated entirely through consistent monthly investing with zero active management.

    $200/Month for 20 Years

    Total contributions: $48,000. Portfolio value: approximately $117,804. Your $48,000 became nearly $118,000 โ€” nearly 2.5x your contributions โ€” through compounding alone. The last decade contributed far more growth than the first, demonstrating why time is the most powerful variable in the equation.

    $200/Month for 30 Years

    Total contributions: $72,000. Portfolio value: approximately $298,072. Nearly $300,000 from $200/month. The compounding in years 20โ€“30 generated more wealth than the previous 20 years combined. This is why starting early โ€” even with modest amounts โ€” matters far more than investing larger amounts later.

    Increasing Contributions Over Time

    The most realistic and powerful approach: increase your monthly DCA contribution each year as your income grows. Starting at $200/month and increasing by $50/year over 30 years (reaching $1,650/month by year 30) would produce dramatically higher outcomes โ€” well into the $600,000โ€“$800,000 range at 8% average returns. The combination of DCA discipline, annual contribution increases, and compound growth is the foundation of how ordinary earners build extraordinary wealth.

    ๐Ÿ”— DCA as Part of Your Complete Investment Strategy

    Dollar-cost averaging isn’t an investment strategy on its own โ€” it’s a contribution methodology. It answers “when and how often to invest” but doesn’t answer “what to invest in” or “how much risk to take.”

    The complete picture requires combining DCA with:

    • Asset allocation: The ratio of stocks to bonds to other assets based on your timeline and risk tolerance
    • Diversification: Spreading investments across market segments, sectors, and geographies
    • Tax optimization: Maximizing tax-advantaged account contributions before taxable accounts
    • Annual rebalancing: Returning to target allocations when markets drift your portfolio away from them

    When DCA combines with a well-diversified portfolio of low-cost index ETFs inside tax-advantaged accounts, reviewed and rebalanced annually, the result is one of the most powerful and reliable wealth-building systems available to individual investors โ€” requiring minimal expertise and minimal active management time.

    To understand the full investment approach that DCA supports, read our comprehensive guides on stock investment strategies, how to invest in stocks step by step, and everything beginners need to know about the stock market.

    ๐ŸŒ DCA Around the World: Different Markets, Same Principle

    Dollar-cost averaging is a universal principle โ€” it works in any liquid market, in any currency, in any country. US investors have the most platform options and the lowest-cost ETFs, but the strategy applies globally.

    European investors: Many European brokers and fintech platforms (Scalable Capital, Trade Republic, DEGIRO) offer automatic investment plans into UCITS ETFs โ€” the European equivalent of US ETFs. The same DCA mechanics apply. Look for iShares, Vanguard, and Amundi UCITS ETFs tracking broad global or regional indices.

    Asian investors: Emerging and developed Asian markets have seen significant fintech growth enabling regular investment plans. Singapore’s brokerage platforms, Hong Kong’s stock connect access to mainland China, and Japan’s NISA tax-advantaged accounts all support DCA-style regular investing into broad market indices.

    Emerging market investors: Currency risk adds complexity for investors in high-inflation environments. Investing in US-dollar-denominated ETFs through international brokers like IBKR provides both market exposure and implicit currency diversification โ€” though local currency fluctuations can significantly affect real returns. Consider this dimension when applying DCA principles to cross-border investing.

    The core principle โ€” consistent, automatic, schedule-driven investment regardless of market conditions โ€” produces its mathematical advantage in any liquid market. The specific implementation details vary by country, brokerage, and tax regime; the underlying logic remains constant.

    โš ๏ธ Common DCA Mistakes to Avoid

    Mistake 1: Treating DCA as a Reason to Ignore Asset Allocation

    DCA tells you how often to invest, not what to invest in. Consistently DCA-ing into a poorly diversified or inappropriate portfolio doesn’t fix bad asset allocation. Get your investment selection right first, then automate contributions through DCA.

    Mistake 2: Stopping During Volatility

    The entire value of DCA comes from maintaining contributions through market downturns โ€” when you accumulate the most shares at the lowest prices. Stopping contributions during crashes converts DCA from wealth-building discipline to a strategy that buys high and pauses during lows. This is the opposite of the intended effect.

    Mistake 3: Setting a Fixed Amount and Never Increasing It

    A $200/month DCA contribution in year 1 should not still be $200/month in year 10 if your income has grown significantly. Failing to increase contributions as your earnings grow leaves substantial wealth-building potential on the table. Set a calendar reminder to review and increase your contribution amount annually.

    Mistake 4: Using DCA for Short-Term Goals

    DCA is a long-term strategy. Investing in volatile assets (stocks, ETFs) through DCA for money you’ll need in 1โ€“3 years exposes that capital to sequence-of-returns risk โ€” if markets crash right before you need the money, you may have to sell at a loss. Short-term goals belong in stable, liquid vehicles: high-yield savings accounts, short-term CDs, or money market funds.

    Mistake 5: Confusing DCA with Active Trading

    DCA is a passive, systematic strategy. Its power comes from removing active decision-making. Some investors set up monthly DCA plans but then override the automation โ€” buying extra when markets seem cheap, pausing when markets seem high. This defeats the purpose. Trust the system. The automation is the strategy.

  • How to Open a Brokerage Account: The Complete Step-by-Step Guide

    How to Open a Brokerage Account: The Complete Step-by-Step Guide

    Most people spend more time researching a new phone than choosing where to put their life savings. Opening the right brokerage account is one of the most consequential financial decisions you’ll make โ€” and most guides make it far more complicated than it needs to be.

    This guide cuts through the noise. You’ll learn exactly what a brokerage account is, how to choose the right one for your situation, every step of the setup process, and the mistakes that cost beginners real money before they even place their first trade.

    ๐Ÿฆ What Is a Brokerage Account?

    A brokerage account is an investment account that lets you buy and sell financial assets โ€” stocks, bonds, ETFs, mutual funds, options, and more. Think of it as the gateway between your cash and the financial markets.

    Unlike a bank account that holds cash, a brokerage account holds both cash and investments. You deposit money, use it to buy assets, and those assets sit in your account โ€” rising and falling with the market โ€” until you sell them.

    There are two broad categories:

    • ๐Ÿ“‹ Taxable Brokerage Account: No special tax treatment. You pay capital gains tax when you sell investments at a profit. No contribution limits. No restrictions on withdrawals. Full flexibility.
    • ๐Ÿ›๏ธ Tax-Advantaged Account: IRA (Individual Retirement Account), 401(k), Roth IRA โ€” designed specifically for retirement savings. Offer tax breaks (deductions or tax-free growth) in exchange for contribution limits and withdrawal restrictions.

    Most investors eventually need both. Start with whichever matches your immediate goal โ€” retirement savings or general investing.

    ๐Ÿ” Step 1: Choose the Right Type of Account

    Before picking a broker, get clear on what you’re investing for:

    If You’re Investing for Retirement

    Start with tax-advantaged accounts before a taxable account:

    • 401(k): If your employer offers one with a match โ€” contribute at least enough to get the full match. That’s an instant 50โ€“100% return on your contribution before the market does anything.
    • Roth IRA: Contributions made with after-tax money. All growth is tax-free. No required minimum distributions. Withdrawals in retirement are 100% tax-free. Best for younger investors who expect to be in a higher tax bracket later.
    • Traditional IRA: Contributions may be tax-deductible. Growth is tax-deferred. Pay taxes when you withdraw in retirement. Best if you expect a lower tax bracket in retirement than now.

    If You’re Investing for General Goals

    A standard taxable brokerage account is your tool. No contribution limits, no withdrawal restrictions, no penalties. You pay capital gains tax on profits when you sell โ€” manageable with smart tax-loss harvesting strategies.

    If You’re Investing for a Child’s Education

    A 529 plan offers tax-free growth specifically for education expenses. Not technically a brokerage account, but worth knowing before you open a general taxable account for this purpose.

    ๐Ÿข Step 2: Choose the Right Broker

    The broker landscape has been transformed in recent years. Commission-free trading is now standard. Fractional shares are widely available. The differences that matter now are more subtle โ€” but they’re real.

    What to Look For

    Zero trading commissions: This is now table stakes. Any broker charging per-trade commissions for US stocks should be disqualified immediately. All major brokers (Fidelity, Schwab, IBKR) offer commission-free stock and ETF trading.

    No account minimums: Many brokers have eliminated minimums entirely. Some still require $500โ€“$1,000 to open. Prioritize brokers that let you start with any amount.

    Fractional shares: Can you buy $50 of Amazon even if one share costs $180? Fractional shares democratize access to expensive stocks and let you invest precise dollar amounts rather than rounding to whole shares.

    Investment selection: Does the broker offer the assets you want? Stocks, ETFs, mutual funds โ€” most brokers cover these. Options, international stocks, bonds, crypto โ€” check specifically if these matter to you.

    Research and tools: For active investors, quality research matters. Fidelity and Schwab are known for excellent research. Platforms like Robinhood are simpler but offer less depth.

    Customer support: When something goes wrong (and eventually it will), can you reach a real person? Phone support, live chat, branch locations โ€” assess what matters to your comfort level.

    Mobile app quality: If you’ll primarily invest from your phone, download the app before committing. Interface quality varies significantly.

    The Major Brokers: Quick Comparison

    Fidelity: Consistently rated among the best overall. Zero commissions, no minimums, fractional shares, excellent research, top-tier customer service, and a highly rated mobile app. Strong choice for most investors โ€” beginner to advanced.

    Charles Schwab: Similar strengths to Fidelity. Particularly strong for long-term investors and those who want branch access. Recently acquired TD Ameritrade, significantly expanding its platform.

    Interactive Brokers (IBKR): The professional’s choice. Access to global markets, lowest margin rates, sophisticated tools. Steeper learning curve. IBKR Lite offers commission-free trading for casual investors.

    Robinhood: Simple, clean interface that attracts beginners. Commission-free, fractional shares. Thinner research and fewer investment options than Fidelity/Schwab. Better for simple stock/ETF investing than complex portfolios.

    Webull: Popular with active traders for its advanced charting tools. Commission-free, extended hours trading. Less suitable for passive long-term investors.

    Vanguard: The gold standard for long-term, passive investors. Home of the lowest-cost index funds and ETFs on the planet. Interface is dated and less beginner-friendly, but if you’re committed to index investing, Vanguard’s fund costs are hard to beat.

    ๐Ÿ“ Step 3: Gather Your Documents

    Opening a brokerage account triggers identity verification requirements โ€” regulated by anti-money laundering (AML) and Know Your Customer (KYC) laws. Have these ready before you start:

    • ๐Ÿชช Government-issued photo ID: Driver’s license or passport
    • ๐Ÿ”ข Social Security Number (SSN) or Individual Taxpayer Identification Number (ITIN)
    • ๐Ÿ  Current address: Your residential address (PO boxes usually not accepted)
    • ๐Ÿ“… Date of birth
    • ๐Ÿฆ Bank account information: Routing and account number for funding your brokerage account
    • ๐Ÿ’ผ Employment information: Employer name, occupation (some brokers ask)
    • ๐Ÿ’ฐ Financial information: Approximate annual income and net worth (used to determine suitable account types)

    For non-US residents: requirements vary by broker and country. Many major US brokers accept international clients โ€” Interactive Brokers is particularly known for global accessibility. You’ll typically need a passport and proof of address.

    ๐Ÿ–ฅ๏ธ Step 4: Complete the Application

    The application process takes 10โ€“20 minutes online. Here’s what you’ll encounter:

    Personal Information

    Name, address, date of birth, SSN/tax ID. Standard identity verification. Some brokers will ask you to upload a photo of your ID; others verify through credit bureau databases without document upload.

    Account Type Selection

    Individual taxable account, joint account, IRA type โ€” choose based on your goals from Step 1. You can open multiple account types with the same broker (many investors have both a Roth IRA and a taxable account at the same institution).

    Investment Profile Questions

    Brokers are legally required to assess your investment experience, risk tolerance, and investment objectives. These questions determine what products you can access (options trading requires additional approval). Answer honestly โ€” this protects both you and the broker.

    • Investment experience: beginner / intermediate / experienced
    • Investment objective: growth / income / capital preservation / speculation
    • Risk tolerance: conservative / moderate / aggressive
    • Time horizon: short-term / medium-term / long-term

    Regulatory Disclosures

    Standard questions about whether you’re a corporate insider, political figure, or affiliated with a broker-dealer. Most individual investors answer “no” to all of these.

    Dividend Reinvestment (DRIP)

    Most brokers ask if you want dividends automatically reinvested to buy more shares. For long-term investors: yes. Automatic reinvestment harnesses compounding without any effort on your part.

    โœ… Step 5: Verify Your Identity

    After submitting your application, the broker verifies your identity. This usually happens one of two ways:

    Instant verification: The broker cross-references your information against credit bureau and public records. Account approved immediately or within minutes. Most common outcome for straightforward applications.

    Manual review: Requires document upload (photo of ID, utility bill for address verification). Takes 1โ€“3 business days. Triggered when automatic verification can’t confirm your identity โ€” common for new-to-credit individuals, recent address changes, or international applicants.

    You’ll receive an email confirmation when your account is approved and ready to fund.

    ๐Ÿ’ณ Step 6: Fund Your Account

    An approved account with $0 can’t buy anything. Fund it through one of these methods:

    ACH Transfer (Most Common)

    Link your bank account using your routing and account numbers. Free, but typically takes 2โ€“5 business days to fully settle. Many brokers offer instant buying power โ€” you can start trading immediately while the transfer is pending, up to a certain limit.

    Wire Transfer

    Faster (same-day or next-day) but usually costs $15โ€“$30 per transfer. Useful for large initial deposits where speed matters.

    Check Deposit

    Mail a physical check or deposit via mobile check capture. Slower โ€” typically 3โ€“7 business days to clear. Rarely the best option but available.

    Transfer from Another Broker (ACATS)

    If you’re moving an existing account, use an ACATS (Automated Customer Account Transfer Service) transfer. Your new broker handles the paperwork. Takes 5โ€“7 business days. Your investments transfer in-kind โ€” you don’t have to sell them first.

    There’s no required minimum for many brokers. Even $50 or $100 is enough to start with fractional shares. The psychological value of starting โ€” even small โ€” is significant. You’ll pay more attention to markets, learn faster, and build the habit of investing consistently.

    ๐Ÿ“ˆ Step 7: Place Your First Trade

    With funds in your account, you’re ready to invest. Here’s how a basic stock purchase works:

    1. ๐Ÿ” Search for the stock: Use the company name or ticker symbol (AAPL for Apple, VOO for Vanguard S&P 500 ETF)
    2. ๐Ÿ“Š Review the stock page: Check the current price, recent performance, and any available research
    3. ๐Ÿ›’ Click “Buy” and choose your order type:
      • Market order: Buys at the current market price. Executes immediately during market hours. Simple and suitable for most beginners.
      • Limit order: Sets a maximum price you’re willing to pay. Only executes if the stock reaches your price. Useful when you want price control.
      • Stop order / Stop-limit order: More advanced order types for managing downside risk. Not necessary to understand immediately.
    4. ๐Ÿ’ฐ Enter the amount: Either the number of shares or the dollar amount (if fractional shares are available)
    5. โœ… Review and confirm: Double-check ticker symbol, amount, order type, and estimated cost before confirming

    After your order executes, the shares appear in your portfolio. You’re now a shareholder. Congratulations โ€” and resist the urge to check the price every 10 minutes.

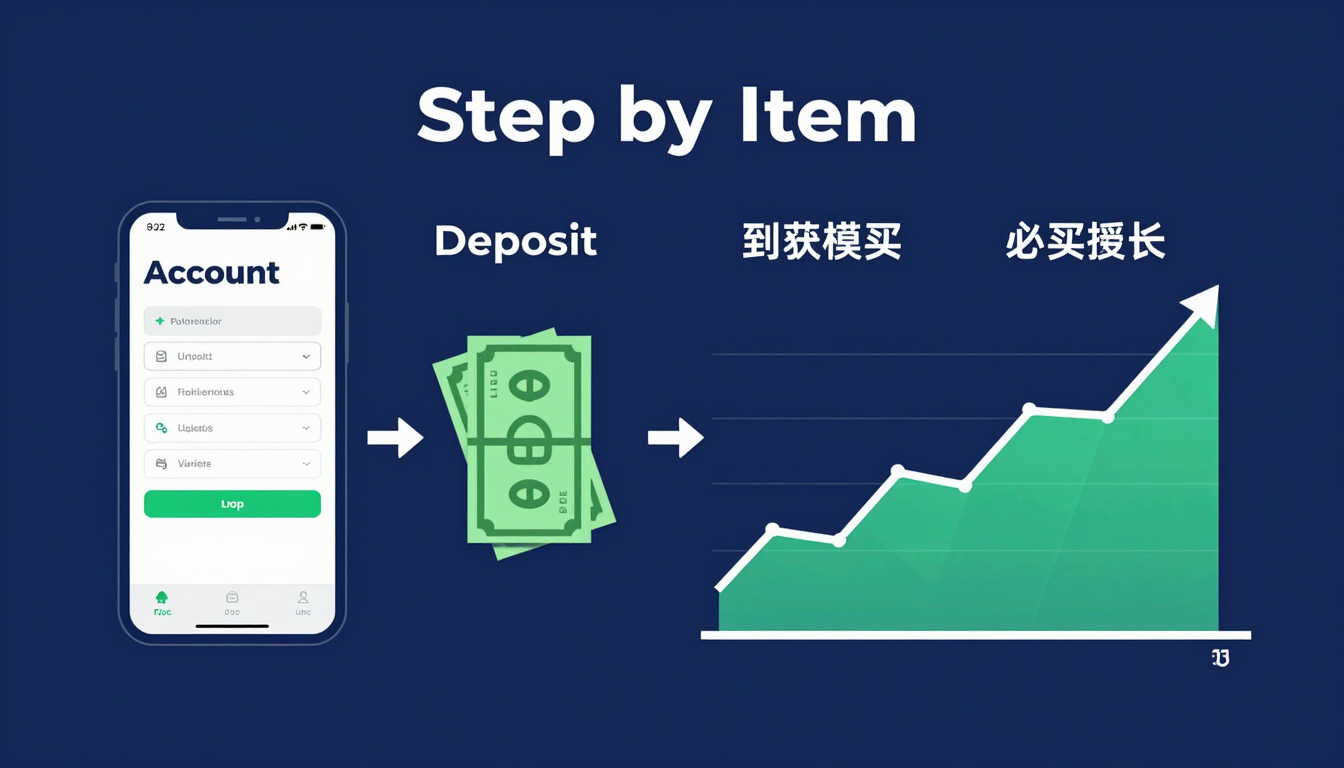
    Step by step brokerage account setup process

    โš ๏ธ Common Mistakes That Cost Beginners Money

    Mistake 1: Choosing a Broker Based on Marketing, Not Features

    Flashy ads and celebrity endorsements don’t indicate quality. Research the actual features that matter for your investing style โ€” fees, investment selection, tools, support โ€” before committing.

    Mistake 2: Not Taking Employer 401(k) Match

    If your employer matches contributions up to 4% and you’re contributing 2%, you’re leaving free money on the table every paycheck. Max the match first โ€” always.

    Mistake 3: Confusing a Brokerage Account for a Savings Account

    Money in a brokerage account is not FDIC-insured like a bank account. Cash held in brokerage accounts is covered by SIPC (Securities Investor Protection Corporation) up to $500,000 against broker failure โ€” but not against investment losses. Never keep emergency funds in a brokerage account.

    Mistake 4: Investing with Money You’ll Need Soon

    Markets can fall 30โ€“40% and stay down for years. Only invest money you genuinely won’t need for at least 3โ€“5 years. Short-term money goes in high-yield savings accounts or CDs โ€” not stocks.

    Mistake 5: Over-Trading Early On

    The temptation to react to every market move is strong for new investors. The data is clear: frequent trading underperforms buy-and-hold investing for most retail investors, primarily due to transaction costs, taxes on short-term gains, and poor market timing. Open your account, build your portfolio, and resist the urge to trade constantly.

    Mistake 6: Ignoring Account Security

    Your brokerage account contains real money. Use a unique, strong password. Enable two-factor authentication (2FA) immediately โ€” most brokers require it but it’s worth double-checking. Never access your account on public WiFi without a VPN.

    ๐Ÿ”’ Understanding Account Protection

    Before you fund your account, understand how your money is protected:

    SIPC Protection: The Securities Investor Protection Corporation insures brokerage accounts up to $500,000 (including up to $250,000 in cash) against broker failure โ€” not investment losses. If your broker goes bankrupt, SIPC ensures your investments are returned. Most major brokers also carry additional private insurance beyond SIPC limits.

    What SIPC Does NOT Cover: Market losses. If your investments decline in value, that’s investment risk, not broker failure. SIPC is about protecting your assets from your broker’s insolvency โ€” not from bad markets.

    Choose regulated brokers: In the US, brokers must be registered with the SEC and FINRA. You can verify any broker’s registration at BrokerCheck (brokercheck.finra.org) before opening an account.

    ๐Ÿš€ Ready to Start Investing?

    Your Account Is Open. Now What?

    Opening an account is step one. Knowing what to buy, how to build a diversified portfolio, and which strategy fits your goals is what separates investors who build wealth from those who just trade.

    โœ… Key Takeaways

    • ๐Ÿ”น A brokerage account is your gateway to financial markets โ€” choose based on fees, features, and your investing style
    • ๐Ÿ”น Tax-advantaged accounts (Roth IRA, 401k) should typically be opened before taxable accounts for retirement savings
    • ๐Ÿ”น Major brokers (Fidelity, Schwab, IBKR) offer commission-free trading โ€” don’t pay per-trade fees
    • ๐Ÿ”น Opening an account takes 10โ€“20 minutes; have your ID, SSN, and bank info ready
    • ๐Ÿ”น Enable two-factor authentication immediately after opening
    • ๐Ÿ”น Fund with ACH transfer โ€” free, just takes a few days to settle
    • ๐Ÿ”น Only invest money you won’t need for at least 3โ€“5 years
    • ๐Ÿ”น SIPC protects against broker failure (up to $500K), not against market losses
    • ๐Ÿ”น Start small if needed โ€” fractional shares let you invest any dollar amount

    The hardest part of investing isn’t knowing what to buy. It’s starting. The account you open today โ€” even funded with $100 โ€” establishes the habit, the platform, and the psychology of an investor. The portfolio will grow from there.

    ๐ŸŒ Opening a Brokerage Account Outside the US

    The guide above focuses primarily on US-based investors. If you’re investing from outside the US, the process differs but the principles remain the same. Here’s what international investors need to know:

    Options for International Investors

    Interactive Brokers (IBKR) is the gold standard for international access. Available in over 200 countries and territories, IBKR gives international investors direct access to US markets, plus exchanges in Europe, Asia, and beyond. The account opening process accommodates international identification documents and addresses.

    Local brokers in your country may offer access to your home market with lower friction โ€” no international wire fees, local-language support, and familiarity with local tax rules. Many now offer international market access as well. Research your country’s equivalent to Fidelity or Schwab.

    Global neo-brokers like eToro, Trading 212, and Saxo Bank serve international clients across multiple countries with clean apps and reasonable fee structures. Research availability and regulation in your specific country before opening.

    Tax Considerations for International Investors

    Investing in US markets from abroad introduces cross-border tax complexity. The US imposes a 30% withholding tax on dividends paid to foreign investors โ€” though tax treaties between the US and many countries reduce this rate significantly (often to 15%). Check whether your country has a tax treaty with the US at IRS.gov.

    Capital gains from selling US stocks may or may not be taxable in your home country depending on local laws. Consult a tax professional familiar with cross-border investing before making substantial investments in foreign markets.

    ๐Ÿ“Š After You Open: Building Your First Portfolio

    Your account is open, funded, and ready. The most common question that follows: “What do I actually buy?”

    The answer depends on your goals, timeline, and risk tolerance โ€” but here are the most sensible starting points for different investor types:

    The Simplest Approach: One Fund

    A single broad-market ETF like VTI (Vanguard Total Stock Market ETF) or VOO (Vanguard S&P 500 ETF) gives you instant diversification across hundreds or thousands of companies in one trade. This approach โ€” championed by Warren Buffett for non-professional investors โ€” requires minimal research, has minimal fees, and has historically outperformed most active stock pickers over 10+ year periods.

    The Three-Fund Portfolio

    A slightly more sophisticated approach that covers the global market:

    • US stocks (VTI or SCHB): 60% of your investment portfolio
    • International stocks (VXUS or IXUS): 30% for geographic diversification
    • Bonds (BND or AGG): 10% for stability (adjust based on your risk tolerance and age)

    Rebalance annually back to your target allocation. That’s it. This simple three-fund structure has formed the foundation of retirement portfolios for decades.

    Individual Stock Picking

    If you want to research and select individual companies, that’s a valid path โ€” but approach it as a learning process and risk management exercise. Keep individual stock picks to a minority of your portfolio (20โ€“30%) while maintaining broad diversification through ETFs for the majority. This lets you participate in individual company growth while protecting against the catastrophic risk of a concentrated position.

    For a detailed guide on evaluating individual companies and building a diversified stock portfolio, see our comprehensive resources on how to find the best stocks to invest in and stock investment strategies that work.

    ๐Ÿ”„ Setting Up Recurring Investments: The Automation Advantage

    The most powerful thing you can do after opening your account isn’t picking the perfect stock โ€” it’s setting up automatic recurring investments.

    Most major brokers allow you to schedule automatic purchases: every week, every two weeks, or every month, a fixed dollar amount automatically buys your chosen ETF or stock. This implements dollar-cost averaging (DCA) without any active effort on your part.

    The psychological and mathematical benefits are substantial:

    • You buy more shares when prices are low and fewer when prices are high โ€” naturally averaging down your cost
    • You eliminate the temptation to time the market
    • You build the investing habit without requiring willpower each month
    • You treat investing like a bill โ€” a non-negotiable regular expense โ€” rather than something you do “when you have extra money”

    Investors who automate contributions consistently outperform those who invest manually, largely because they stay invested through market turbulence instead of pausing contributions during crashes โ€” precisely when buying is most advantageous.

    Set it up on day one. Even $50 or $100 per month, invested consistently in a diversified ETF over 20โ€“30 years, produces remarkable outcomes through the power of compounding. For a complete walkthrough of investment strategies and how to structure your portfolio for long-term growth, read our detailed guide on how to invest in stocks step by step.

    โ“ Frequently Asked Questions

    How long does it take to open a brokerage account?

    The application itself takes 10โ€“20 minutes. Instant approval is common with major brokers like Fidelity and Schwab. Manual identity verification can add 1โ€“3 business days. Funding via ACH bank transfer takes 2โ€“5 business days to fully settle, though many brokers offer instant buying power while the transfer clears.

    Is there a minimum amount to open a brokerage account?

    Most major brokers have eliminated minimum account balances entirely. Fidelity, Schwab, and Robinhood all require $0 to open. Some specialty platforms and mutual funds still require minimums of $500โ€“$3,000. If minimum requirements are a barrier, start with zero-minimum brokers and build from there.

    Can I have multiple brokerage accounts?

    Yes โ€” there’s no legal limit on the number of brokerage accounts you can hold. Many investors have a Roth IRA at one broker, a taxable account at another, and a 401(k) through their employer. The main consideration is whether you can effectively monitor and manage multiple accounts. For most beginners, consolidating at one or two brokers keeps things manageable.

    What happens to my investments if my broker goes bankrupt?

    Your investments are held separately from your broker’s assets under SEC regulations โ€” they don’t become part of the broker’s estate if it fails. SIPC insurance covers up to $500,000 in securities and $250,000 in cash during a broker insolvency. In practice, SIPC liquidations return investor assets. The risk of a major regulated broker failing and taking investor assets is extremely low โ€” but understand the protection structure before you invest.

    Do I need a Social Security Number to open a brokerage account?

    For US residents, yes โ€” brokers are required to collect your SSN or ITIN for tax reporting purposes. Foreign nationals living in the US who don’t have an SSN can use an ITIN. Non-US residents investing through US brokers typically provide their home country tax ID and passport. Some international brokers operate outside the SSN requirement for foreign investors.

    Can I open a brokerage account as a minor?

    Minors cannot open brokerage accounts independently. However, custodial accounts (UGMA/UTMA) allow parents or guardians to open and manage investment accounts on behalf of a minor. The assets legally transfer to the minor when they reach adulthood (typically 18 or 21 depending on the state). Custodial Roth IRAs are also available for minors who have earned income.

  • Stocks vs Bonds: The Definitive Guide to Building a Portfolio That Lasts

    Stocks vs Bonds: The Definitive Guide to Building a Portfolio That Lasts

    Two investors walk into a financial adviser’s office. Both want to grow their money. Both are nervous about losing it. One leaves with stocks. One leaves with bonds. Ten years later, their outcomes are wildly different โ€” and both were right to choose what they chose.

    This is the stocks vs. bonds debate. Not a winner-take-all fight, but a genuine strategic choice that every investor must make โ€” and keep making โ€” throughout their financial life.

    This guide breaks down exactly what each instrument is, how they make (or protect) your money, when one beats the other, and how to think about the mix that’s right for you.

    โš”๏ธ The Core Difference: Ownership vs. Lending

    At the most fundamental level, stocks and bonds represent two completely different relationships with a company or government:

    When you buy a stock, you become a part-owner. You share in the company’s success when it grows โ€” and share in its pain when it struggles. There’s no guaranteed return. No promised payment. Just ownership and everything that comes with it.

    When you buy a bond, you become a lender. You hand over money to a company or government in exchange for a formal promise: they’ll pay you regular interest, and return your principal at a specific date. You’re a creditor, not an owner.

    This single distinction โ€” ownership vs. lending โ€” explains virtually every difference in how stocks and bonds behave, pay, and risk.

    ๐Ÿ“ˆ How Stocks Work (Quick Recap)

    A stock represents a fractional ownership stake in a corporation. Buy 100 shares of a company that has 10 million shares outstanding, and you own 0.001% of that business โ€” its assets, its future earnings, its brand, everything.

    Stocks generate returns in two ways:

    • ๐Ÿš€ Capital appreciation: The share price rises as the company grows and becomes more valuable
    • ๐Ÿ’ต Dividends: Some companies distribute a portion of profits directly to shareholders as cash payments

    Neither is guaranteed. A company can go bankrupt, its stock going to zero. Or it can become the next Apple โ€” turning a $1,000 investment into $100,000+ over decades. The range of outcomes is enormous, which is exactly why stocks carry more risk โ€” and historically deliver more reward โ€” than bonds.

    For a deep dive into stocks, see our complete guide on what is a stock.

    ๐Ÿ“œ How Bonds Work

    A bond is a debt instrument โ€” a formalized IOU. When a company or government needs to raise money without selling ownership, it issues bonds. Investors buy those bonds and become creditors.

    Every bond has three core components:

    • ๐Ÿท๏ธ Face Value (Par Value): The amount the bond issuer promises to return at maturity โ€” typically $1,000 per bond
    • ๐Ÿ’ฐ Coupon Rate: The annual interest rate paid on the face value. A 5% coupon on a $1,000 bond = $50/year in interest payments
    • ๐Ÿ“… Maturity Date: The date when the issuer repays the face value. Bonds can mature in 1 year, 10 years, or 30 years

    Example: You buy a 10-year US Treasury bond with a 4.5% coupon at face value ($1,000). Every year, you receive $45 in interest. After 10 years, you get your $1,000 back. Total return over the decade: $450 in interest + $1,000 principal = $1,450. Simple, predictable, low drama.

    Types of Bonds

    • ๐Ÿ›๏ธ Government Bonds: Issued by national governments. US Treasuries are considered the safest investment on Earth โ€” backed by the full faith and credit of the US government. Ultra-low risk, lower yields.
    • ๐Ÿข Corporate Bonds: Issued by companies. Higher risk than government bonds (companies can default), but pay higher interest to compensate.
    • ๐Ÿ™๏ธ Municipal Bonds (Munis): Issued by state and local governments. Often tax-advantaged โ€” interest is typically exempt from federal income tax.
    • ๐ŸŒ Emerging Market Bonds: Government or corporate bonds from developing countries. Higher yields, higher risk of default or currency fluctuation.
    • โš ๏ธ High-Yield Bonds (Junk Bonds): Corporate bonds from companies with lower credit ratings. Significantly higher interest payments โ€” but real risk of default.

    ๐Ÿ“Š The Numbers: Historical Performance

    Data resolves most debates. Here’s what the historical record shows about stocks vs. bonds over long periods:

    The S&P 500 (US stocks) has delivered approximately 10% average annual returns since 1926 โ€” or about 7% after inflation. That means $10,000 invested in 1996 grew to roughly $67,000 by 2026, before accounting for taxes.

    US Treasury bonds have historically returned around 4โ€“5% annually in nominal terms โ€” closer to 1โ€“2% after inflation. That same $10,000 in 1996 would have grown to approximately $26,000โ€“$32,000 by 2026.

    The gap is substantial. Over 30 years, stocks produced more than double the terminal wealth of bonds. But that outperformance came with dramatic volatility โ€” crashes of 30%, 40%, even 50% along the way. Bonds provided smoother, more predictable โ€” if smaller โ€” returns throughout.

    This is the central trade-off: stocks offer higher potential returns at higher risk; bonds offer lower returns with greater stability and predictability.

    ๐ŸŒŠ Risk Profile: A Detailed Comparison

    Stock Risks

    • Company risk: Individual companies can fail completely, wiping out your investment in that stock
    • Market risk: Broad market crashes affect virtually all stocks simultaneously (2008: -57%, 2020: -34%)
    • Volatility risk: Daily and weekly price swings are normal and can be emotionally taxing
    • No guaranteed income: Dividends can be cut or eliminated; price appreciation is never guaranteed

    Bond Risks

    • Interest rate risk: When interest rates rise, existing bond prices fall. A bond paying 3% becomes less attractive when new bonds pay 5% โ€” its price drops to compensate. This is the primary risk for bond investors.
    • Credit/default risk: The issuer might fail to make interest payments or return principal. Government bonds have minimal default risk; high-yield corporate bonds carry substantial default risk.
    • Inflation risk: Fixed interest payments lose purchasing power when inflation rises. A 3% bond return during 4% inflation represents a real loss of 1% annually.
    • Liquidity risk: Some bonds trade infrequently and can be difficult to sell at fair prices before maturity.

    Importantly, bonds are not risk-free โ€” they carry different risks than stocks. The 2022 bond market demonstrated this dramatically: rising interest rates caused US Treasury bonds to fall 15โ€“20% in value, their worst year in decades, while many investors had assumed bonds were “safe.”

    ๐Ÿ”„ When Stocks and Bonds Move in Opposite Directions

    One of the most valuable characteristics of combining stocks and bonds is their historical tendency to move in opposite directions โ€” what investors call negative correlation.

    During recessions and market panics, investors typically sell stocks (fear of falling earnings) and buy bonds (flight to safety). This dynamic means bonds often rise in value precisely when stocks are falling โ€” cushioning portfolio drawdowns.

    During economic expansions, investors rotate into stocks for growth, sometimes selling bonds (causing bond prices to fall). Stocks rise. Bonds may fall slightly or stay flat.

    This inverse relationship (which is not always consistent โ€” 2022 showed both can fall simultaneously) is why the classic 60/40 portfolio (60% stocks, 40% bonds) has been the foundation of institutional investing for decades. The bonds don’t eliminate losses, but they meaningfully reduce portfolio volatility.

    ๐Ÿ’ผ Who Should Own What? The Decision Framework

    The right stocks vs. bonds allocation depends on three factors: your time horizon, your risk tolerance, and your income needs.

    โฐ Time Horizon

    Time is the most powerful variable. The longer your investment horizon, the more stock risk you can absorb โ€” because short-term crashes become noise in a 20โ€“30 year growth story.

    • 30+ years to retirement: Most advisers suggest 80โ€“100% stocks. You have time to recover from crashes and compound growth aggressively.
    • 15โ€“20 years: 70โ€“80% stocks, 20โ€“30% bonds. Starting to introduce stability as the timeline shortens.
    • 5โ€“10 years: 50โ€“60% stocks, 40โ€“50% bonds. Balancing growth with capital preservation.
    • Under 5 years: 20โ€“40% stocks at most. When you’ll need the money soon, you can’t afford a market crash to cut your portfolio in half right before you need it.

    ๐Ÿ˜ฐ Risk Tolerance

    Time horizon aside, some investors simply cannot stomach watching their portfolio fall 40% โ€” even if they rationally know it will recover. If market crashes cause you to lose sleep or panic-sell (which destroys returns), a higher bond allocation isn’t weakness โ€” it’s wisdom. The best portfolio is one you can stick to through turbulence.

    ๐Ÿ’ธ Income Needs

    Retirees who need predictable income from their portfolio often prefer bonds for their regular coupon payments. Younger investors who don’t need to draw on their portfolio can tolerate stocks’ higher volatility in pursuit of long-term growth.

    ๐Ÿ† The Classic Portfolio Mixes

    Investment history has produced several time-tested allocation frameworks:

    100% Stocks (Aggressive Growth): Maximum long-term growth potential. Accept full market volatility. Suitable for young investors with 20+ year horizons and high risk tolerance.

    80/20 (Growth-Oriented): Primarily stocks with a small bond cushion. Reduced volatility while maintaining strong long-term growth exposure. Popular for investors in their 30sโ€“40s.

    60/40 (Balanced): The classic institutional standard. Stocks for growth, bonds for stability and income. Suitable for mid-career investors or those approaching retirement within 10โ€“15 years.

    40/60 (Conservative): Bonds-dominant. Prioritizes capital preservation and income over growth. Common for retirees who can’t afford significant principal loss.

    100% Bonds (Capital Preservation): Appropriate only when you need the money very soon or have extremely low risk tolerance. Sacrifices substantial long-term growth.

    Note: These are starting frameworks, not rigid rules. Your specific situation โ€” income, expenses, other assets, tax situation โ€” should inform your actual allocation. A fee-only financial advisor can help personalize this.

    ๐Ÿ†š The Head-to-Head Breakdown

    Potential Returns: Stocks win decisively over long periods. Historically 10% annually vs. 4โ€“5% for bonds. The gap compounds dramatically over decades.

    Income: Bonds win for predictability. Fixed coupon payments on a known schedule. Dividend stocks provide income but with less certainty โ€” dividends can be cut.

    Volatility: Bonds win. Far smaller price swings day-to-day and year-to-year. Much easier to hold through market turbulence without emotional reactions.

    Inflation Protection: Stocks win. Companies can raise prices and grow revenues in line with inflation. Fixed bond payments do not adjust for inflation โ€” their real value erodes.

    Liquidity: Large-cap stocks win. Major stocks trade millions of shares daily โ€” instant entry and exit. Many bonds trade infrequently and are harder to sell at fair prices.

    Simplicity: Both are accessible through any brokerage. Bond ETFs and stock ETFs have made both equally simple to buy for retail investors.

    Bankruptcy protection: Bonds win. Bond holders are creditors โ€” they’re paid before stockholders in a bankruptcy. Common stockholders often get nothing when a company fails.

    ๐ŸŒ Beyond the Basics: Bond ETFs vs. Individual Bonds

    Most individual investors don’t buy individual bonds โ€” they buy bond ETFs (Exchange-Traded Funds) or bond mutual funds. These pool hundreds or thousands of bonds together, providing instant diversification and making bonds as easy to buy and sell as stocks.

    Popular bond ETFs include:

    • BND (Vanguard Total Bond Market ETF) โ€” broad US bond market exposure
    • AGG (iShares Core US Aggregate Bond ETF) โ€” similar broad coverage
    • TLT (iShares 20+ Year Treasury Bond ETF) โ€” long-duration US Treasuries, higher interest rate sensitivity
    • LQD (iShares iBoxx Investment Grade Corporate Bond ETF) โ€” investment-grade corporate bonds
    • HYG (iShares iBoxx High Yield Corporate Bond ETF) โ€” high-yield (junk) bonds, higher risk and yield

    Bond ETFs provide the stability and income characteristics of bonds while maintaining the liquidity and accessibility of stocks โ€” a practical solution for most retail investors.

    ๐Ÿง  The Psychological Edge of Bonds

    Here’s something most financial guides skip: bonds have a psychological value that’s hard to quantify but very real.

    During the 2008 financial crisis, investors who held 60% stocks / 40% bonds saw their portfolios fall perhaps 25โ€“30%. Investors fully in stocks saw 50โ€“57% losses. The difference isn’t just mathematical โ€” it’s the difference between staying invested and panic-selling at the bottom.

    Investors who sold stocks at the March 2009 bottom โ€” right before the decade-long bull market โ€” locked in catastrophic losses. Many never recovered psychologically or financially. The bonds in their portfolio would have given them something to “rebalance from” โ€” selling bonds that had held value and buying stocks cheaply. This rebalancing discipline is one of the most powerful (and underused) tools in long-term investing.

    The “right” portfolio isn’t purely mathematical. It’s the allocation you can hold through a 40% crash without selling in panic. For most people, that requires some bonds โ€” even if the math says 100% stocks is theoretically optimal over 30 years.

    โš–๏ธ Find Your Balance

    Build a Portfolio That Fits You

    Understanding stocks vs bonds is step one. Building a real strategy around your goals, timeline, and risk tolerance is step two.

    โœ… Key Takeaways

    • ๐Ÿ”น Stocks = ownership in a company. Bonds = lending money to a company or government
    • ๐Ÿ”น Stocks historically deliver ~10% annually; bonds ~4โ€“5%. The gap compounds dramatically over decades
    • ๐Ÿ”น Bonds provide predictable income and reduce portfolio volatility โ€” but are not risk-free
    • ๐Ÿ”น Interest rate risk is bonds’ biggest threat: rising rates cause bond prices to fall
    • ๐Ÿ”น Stocks beat inflation; fixed bonds lose real value when inflation runs hot
    • ๐Ÿ”น The right mix depends on your time horizon, risk tolerance, and income needs
    • ๐Ÿ”น Most investors benefit from holding both โ€” the balance shifts based on life stage
    • ๐Ÿ”น Bonds’ psychological value (reducing panic-selling urge) may be as important as their mathematical role

    The stocks vs. bonds debate has no universal winner. The right answer depends entirely on who you are, when you’ll need the money, and how much volatility you can genuinely tolerate. What matters most: pick a mix you can commit to through both bull markets and crashes โ€” and then stay the course.

    ๐Ÿ” Practical Guide: How to Buy Stocks and Bonds Today

    Both stocks and bonds are accessible through any standard brokerage account. Here’s how each works in practice for a retail investor.

    Buying Stocks

    1. Open a brokerage account (Fidelity, Schwab, Interactive Brokers, or your country’s equivalent)
    2. Search for the company by name or ticker symbol
    3. Decide how many shares to buy (fractional shares let you invest any dollar amount)
    4. Place a market order (buys at current price) or limit order (sets your maximum price)
    5. The trade executes and you become a shareholder

    Most major brokerages now offer commission-free stock trading. You can start with as little as $1 using fractional shares on platforms like Fidelity or Charles Schwab.

    Buying Bonds

    Individual bonds can be purchased through brokerages, but most retail investors find bond ETFs simpler and more practical:

    1. Search for a bond ETF (BND, AGG, TLT, or similar) in your brokerage
    2. Buy shares just like a stock โ€” instant liquidity, no minimum beyond the share price
    3. Receive regular dividend distributions representing the bond interest

    For US Treasury bonds specifically, you can also buy directly from the US government at TreasuryDirect.gov โ€” no brokerage needed, no fees, and you’re buying directly from the issuer.

    Tax Considerations

    Stocks and bonds are taxed differently, and this matters for your net returns:

    • Stock gains: Capital gains tax applies when you sell at a profit. Long-term gains (held over 1 year) are taxed at lower rates (0%, 15%, or 20% depending on income in the US). Short-term gains taxed as ordinary income.
    • Dividends: Qualified dividends taxed at lower capital gains rates. Non-qualified dividends taxed as ordinary income.
    • Bond interest: Typically taxed as ordinary income โ€” which can be significantly higher than capital gains rates. This is why bonds are often better held in tax-advantaged accounts (IRA, 401k) where interest compounds tax-free.
    • Municipal bonds: Interest is federally tax-exempt (often state-exempt too) โ€” making them particularly valuable for high-income investors in high tax brackets.

    This tax asymmetry โ€” stocks taxed at preferential rates, bond interest taxed as ordinary income โ€” is one reason many advisers recommend holding bonds in tax-advantaged accounts and stocks in taxable accounts when possible.

    ๐Ÿ“‰ What History Teaches: The 2022 Wake-Up Call

    For decades, the conventional wisdom was clear: when stocks crash, bonds protect you. The 2022 market provided a jarring exception โ€” and understanding why matters.

    In 2022, inflation surged to 8โ€“9% โ€” levels not seen since the 1980s. The Federal Reserve responded with the most aggressive interest rate hiking cycle in 40 years. The result: US stocks fell roughly 20%. Long-duration bonds (like 20-year Treasuries) fell 30โ€“40%. Both asset classes were crushed simultaneously.

    Why? Because rising interest rates hurt both. Higher rates compress stock valuations (future earnings are worth less when discounted at higher rates) and directly crush bond prices (existing bonds paying lower rates become less attractive compared to new bonds paying higher rates).

    The lesson: bonds are not automatically “safe” in all environments. They protect against stock market panics and recessions, but they suffer badly in inflationary, rising-rate environments. A complete investment strategy accounts for multiple risk scenarios โ€” not just stock market crashes.

    Some investors added inflation-protected bonds (TIPS โ€” Treasury Inflation-Protected Securities) as a partial solution. TIPS adjust their principal value with inflation, so they protect purchasing power even when regular bonds lose it. They don’t outperform in all environments, but they add genuine inflation protection that regular bonds lack.

    ๐ŸŒฑ The Lifecycle View: How Your Mix Should Evolve

    Smart investors don’t set their stock/bond allocation once and forget it. The optimal mix genuinely changes as your life changes.

    In Your 20s: You have the most valuable investment asset of all โ€” time. 30โ€“40 years of compounding can turn modest monthly contributions into significant wealth. A heavy stock allocation (80โ€“100%) makes mathematical sense. Short-term crashes are irrelevant to your 2050 retirement.

    In Your 30sโ€“40s: Peak earning years. Still plenty of time to recover from crashes. 70โ€“80% stocks remains reasonable. Start thinking about the role bonds will play as you get closer to retirement.

    In Your 50s: The transition zone. You can’t afford a market crash to cut your portfolio in half five years before you need it. Gradually shift toward 50โ€“60% stocks. Bonds provide the cushion that lets you retire on schedule regardless of what the market does the year before retirement.

    In Retirement: Your primary concern shifts from growth to preservation and income. A 40โ€“60% bond allocation is common โ€” enough stocks to keep pace with inflation and provide long-term growth, enough bonds to fund living expenses without selling stocks during downturns.

    The classic rule of thumb โ€” “100 minus your age = stock percentage” โ€” is outdated given longer lifespans, but captures the right intuition. As you age, gradually reduce risk. Don’t wait until retirement to make the shift. To learn how to build a portfolio that evolves with you, read our complete guide on what stock investment really means and how to get started investing in stocks step by step.

    ๐Ÿค” Common Questions About Stocks vs. Bonds

    Can I lose all my money in bonds?

    With government bonds from stable countries (US, UK, Germany, Japan), the practical risk of losing all your money is extremely low โ€” these governments have not defaulted in modern history. With corporate bonds, particularly high-yield bonds, default risk is real. Diversifying through bond ETFs significantly reduces this risk โ€” even if a few bonds in the fund default, the impact on your overall position is minimal.

    Should I own international bonds?

    International bonds add geographic diversification but introduce currency risk โ€” the value of your returns fluctuates with exchange rates even if the bond itself performs perfectly. Developed market international bonds (European governments, Japan) add modest diversification. Emerging market bonds offer higher yields at much higher risk. Most beginner investors start with domestic bonds before venturing international.

    Are bonds worth it with low interest rates?

    When rates are very low (as they were 2009โ€“2021), bonds offer minimal yield and investors often question their value. Even then, bonds serve their primary portfolio function: reducing volatility and protecting against stock market crashes. A 2% bond isn’t exciting โ€” but if it prevents you from panic-selling stocks during a crash and locking in massive losses, it’s earned its place.

    What’s the difference between bond yield and coupon rate?

    The coupon rate is fixed โ€” it’s the annual interest rate set when the bond was issued. The yield is dynamic โ€” it reflects the actual return given the bond’s current market price. If you buy a $1,000 bond with a 4% coupon for $900 (because rates rose and its price fell), your actual yield is higher than 4%, because you’re getting $40/year on a $900 investment. Yield moves inversely with bond price โ€” this is the core mechanic of bond markets.

    Can stocks and bonds both crash at the same time?

    Yes โ€” 2022 demonstrated this clearly. The historical negative correlation between stocks and bonds is a tendency, not a law. In inflationary environments where central banks aggressively raise rates, both asset classes can fall simultaneously. This is why some investors also hold inflation-linked bonds (TIPS), commodities, or real assets as additional portfolio diversifiers beyond the traditional stock/bond mix.

  • What Is a Stock? The Complete Beginner’s Guide to Owning a Piece of a Company

    What Is a Stock? The Complete Beginner’s Guide to Owning a Piece of a Company

    You don’t need to be rich to own Apple. You don’t need a board seat to profit when Tesla grows. You just need to understand one deceptively simple concept: a stock.

    This guide breaks down everything โ€” what a stock actually is, how it makes you money, the risks nobody warns you about, and why millions of ordinary people use stocks to build extraordinary wealth. No jargon. No fluff. Just the real picture.

    ๐Ÿ• The Pizza Slice Analogy (And Why It Works)

    Imagine a company is a pizza. The whole pizza represents 100% ownership of that business โ€” its assets, its profits, its future. Now imagine the founders slice that pizza into 10 million equal pieces to sell to the public. Each slice is a share of stock.

    When you buy one share, you own one slice. Buy 1,000 shares? You own 1,000 slices. The pizza gets more valuable as the company grows โ€” better products, higher revenues, expanding markets โ€” and so does your slice.

    That’s the essence of stock ownership: you own a proportional piece of a real business.

    But unlike pizza, your slice can pay you income while you hold it, and you can sell it to someone else the moment you want out โ€” often within seconds.

    ๐Ÿ“– The Technical Definition (Simplified)

    A stock (also called equity) is a financial instrument that represents ownership in a corporation. When a company issues stock, it divides its ownership into equal units called shares. Shareholders are part-owners of the company, entitled to a portion of its assets and earnings proportional to their holdings.

    The terms stock and share are used interchangeably in everyday language, but technically:

    • ๐Ÿ’ผ Stock is the general concept โ€” “I invest in stocks”
    • ๐Ÿ“„ Share is a specific unit โ€” “I own 50 shares of Microsoft”

    For all practical purposes, they mean the same thing when you’re investing.

    ๐Ÿ—๏ธ Why Do Companies Sell Stocks?

    Every company, at some point, needs money to grow. There are two fundamental ways to get it:

    Option 1: Borrow (Debt) โ€” take a bank loan or issue bonds. The company owes money back with interest, regardless of whether it succeeds or fails.

    Option 2: Sell Ownership (Equity) โ€” issue shares to the public. Investors become co-owners and share in both the upside and the downside. No repayment required.

    When a company first sells shares to the public, it’s called an IPO โ€” Initial Public Offering. This is the company’s debut on a stock exchange. After the IPO, the company has the cash it raised. From that point forward, shares trade between investors on the open market โ€” the company is no longer directly involved in most transactions.

    This is why understanding stocks matters: when you buy shares after an IPO, you’re not funding the company. You’re buying partial ownership from another investor who’s ready to sell.

    ๐Ÿ’ฐ The Two Ways Stocks Make You Money

    Stock ownership can generate wealth through two distinct mechanisms โ€” and understanding both changes how you evaluate any investment.

    1. Capital Appreciation โ€” The Price Goes Up

    If you buy a stock at $40 and it rises to $75, you’ve gained $35 per share. That gain, realized when you sell, is called capital appreciation. It’s the most commonly cited way investors profit from stocks.

    What drives prices up? At the fundamental level: the company becomes more valuable. Higher revenues, better profit margins, strong competitive position, expanding markets โ€” all of these justify a higher share price over time. The market is essentially a continuous auction where millions of investors vote with their money on what they think a company is worth.

    2. Dividends โ€” The Company Pays You

    Some companies distribute a portion of their profits directly to shareholders as dividends โ€” typically cash payments made quarterly. If you own 500 shares and the company pays a $0.50 quarterly dividend, you receive $250 every three months without selling a single share.

    Not all companies pay dividends. Fast-growing companies (early-stage tech, biotech) usually reinvest all profits to fuel expansion. Mature, stable companies (utilities, consumer staples, financial institutions) tend to be reliable dividend payers.

    The most powerful long-term returns often combine both: a stock that grows in value and pays dividends you reinvest to buy more shares. This compounding engine is how patient investors build substantial wealth over decades.

    ๐Ÿ”ต Common Stock vs. Preferred Stock: Know the Difference

    When people say “stocks,” they almost always mean common stock. But there’s another category worth knowing.

    Common Stock

    • โœ… Voting rights at annual shareholder meetings
    • โœ… Potential to receive dividends (not guaranteed)
    • โœ… Unlimited upside if the company grows
    • โš ๏ธ Last in line if the company goes bankrupt
    • โš ๏ธ Dividends can be cut or eliminated at any time

    Preferred Stock

    • โœ… Fixed dividend payments โ€” paid before common shareholders
    • โœ… Priority claim on assets in liquidation
    • โœ… More predictable income stream
    • โŒ Usually no voting rights
    • โŒ Limited upside โ€” price doesn’t grow as much as common stock

    Preferred stock sits somewhere between a bond and common stock โ€” it’s more stable but gives up growth potential. Most retail investors stick to common stock. Preferred shares appear more often in institutional portfolios or when investing in specific sectors like banking and real estate.

    ๐Ÿ“Š What Actually Moves a Stock’s Price?

    Stock prices aren’t random. They respond to a complex web of signals, and understanding the major drivers helps you make smarter decisions โ€” and avoid emotional reactions.

    ๐Ÿข Company-Specific Factors

    • Earnings reports: Every quarter, companies report revenue and profit. Beat expectations โ†’ stock typically rises. Miss expectations โ†’ stock typically falls. Sometimes significantly.
    • Revenue growth: Is the company growing its sales? Stagnant revenue in a growing industry is a red flag.
    • Leadership changes: A new CEO or CFO can dramatically shift investor confidence.
    • Product launches or failures: A breakthrough product can send a stock soaring; a major product failure can crash it.
    • Mergers and acquisitions: Acquisition targets often see their stock jump 20โ€“40% on announcement day.

    ๐ŸŒ Macro-Economic Factors

    • Interest rates: When the Federal Reserve raises rates, borrowing becomes more expensive, business investment slows, and investors often rotate from stocks to bonds. Rate cuts tend to boost stocks.
    • Inflation: Moderate inflation is normal. High, persistent inflation erodes purchasing power and squeezes company margins.
    • GDP growth: A growing economy generally means growing corporate revenues.
    • Employment data: Strong employment = consumer spending power = company revenues.

    ๐Ÿง  Sentiment and Psychology

    Here’s what surprises most beginners: stock prices aren’t always rational. Fear, greed, hype, and narrative drive significant short-term price movements. A company can have excellent fundamentals and still see its stock fall 30% during a market panic. Understanding this protects you from making decisions based on short-term noise rather than long-term value.

    For a complete picture of how these forces interact in real time, read our guide on how the stock market works.

    โš ๏ธ The Risks Nobody Talks About Clearly

    Every investment book mentions risk. Few explain it concretely enough to actually change behavior. Here’s a realistic picture:

    Company Risk (Specific Risk)

    If you own stock in one company and it fails โ€” think Enron, Lehman Brothers, Bed Bath & Beyond โ€” you can lose everything you invested in that position. This is the most severe form of stock risk, and it’s why diversification exists.

    Market Risk (Systematic Risk)

    Even great companies fall during market-wide crashes. In 2008, virtually every stock fell. In March 2020, even the strongest companies dropped 30โ€“40% in weeks. This risk can’t be eliminated through diversification โ€” it affects the whole market.

    Volatility Risk

    Stocks fluctuate daily. A 2% daily move is completely normal. A 10โ€“20% correction over a few weeks happens regularly. If you can’t stomach seeing your portfolio drop 30% on paper without panic-selling, you need to adjust your allocation before you invest โ€” not during the crash.

    Liquidity Risk

    Large-cap stocks (Apple, Microsoft, Amazon) trade millions of shares daily โ€” you can buy or sell instantly. Smaller, less-traded stocks may have thin markets where selling a large position moves the price against you. Know what you own.

    Risk and return are permanently connected. Higher potential returns require accepting higher risk. The goal isn’t to eliminate risk โ€” it’s to take the right amount of risk for your timeline, goals, and emotional capacity. Our guide on stock investment strategies covers risk management frameworks in detail.

    ๐Ÿ›๏ธ Where Stocks Trade: The Exchanges

    Stocks don’t trade in a physical building anymore โ€” everything is digital. But exchanges still provide the structure, rules, and infrastructure that make orderly trading possible.

    • ๐Ÿ‡บ๐Ÿ‡ธ NYSE (New York Stock Exchange): The world’s largest by market capitalization. Home to blue-chip giants โ€” Coca-Cola, JPMorgan Chase, Exxon Mobil, Walmart.
    • ๐Ÿ–ฅ๏ธ Nasdaq: Technology-heavy exchange. Apple, Microsoft, Amazon, Alphabet, Meta โ€” all listed here. Known for higher-growth, higher-volatility companies.
    • ๐Ÿ‡ฌ๐Ÿ‡ง London Stock Exchange (LSE): Europe’s largest exchange. Gateway to international diversification.
    • ๐Ÿ‡ฏ๐Ÿ‡ต Tokyo Stock Exchange (TSE): Asia’s dominant market. Home to Toyota, Sony, SoftBank.
    • ๐Ÿ‡จ๐Ÿ‡ณ Shanghai and Shenzhen: China’s major exchanges โ€” increasingly important globally.

    Through your brokerage, you can access stocks on any of these exchanges. Your buy order routes electronically, matches with a seller, and executes โ€” often in milliseconds.

    ๐Ÿ”‘ Essential Stock Market Vocabulary

    Fluency in the language of stocks removes the intimidation factor. These are the terms you’ll encounter constantly:

    • ๐Ÿ“ Market Capitalization: Share price ร— total shares outstanding. Tells you a company’s total market value. Large-cap (>$10B), mid-cap ($2โ€“10B), small-cap (<$2B).
    • ๐Ÿ“ˆ P/E Ratio (Price-to-Earnings): What you pay per dollar of earnings. P/E of 20 means you’re paying $20 for every $1 of annual profit. High P/E = high growth expectations. Low P/E = value territory or declining business.
    • ๐Ÿ’ต EPS (Earnings Per Share): Net profit รท shares outstanding. A core profitability metric โ€” rising EPS over time signals a healthy, growing business.
    • ๐Ÿ“‰ Dividend Yield: Annual dividend รท share price, expressed as a percentage. A 4% yield means you receive $4 annually for every $100 invested.
    • ๐Ÿ‚ Bull Market: Sustained price increases of 20%+ from a recent low. Generally associated with economic optimism and expansion.
    • ๐Ÿป Bear Market: Sustained price decline of 20%+ from a recent high. Associated with economic slowdown, recession fears, or broad pessimism.
    • ๐Ÿ“‰ Correction: A 10โ€“20% decline from a recent peak. Normal and healthy โ€” corrections happen roughly once a year on average.
    • ๐ŸŽฏ 52-Week High/Low: The highest and lowest price a stock has traded over the past year. Useful context for evaluating current price relative to recent history.
    • ๐Ÿ’ง Liquidity: How easily you can buy or sell a stock without significantly affecting its price. High volume = high liquidity = easy entry/exit.

    ๐Ÿ“ฑ How to Buy Your First Stock (In 5 Steps)

    The mechanics of buying stock are simpler than most people expect. Here’s the complete flow:

    1. ๐Ÿฆ Choose a brokerage: Commission-free platforms like Fidelity, Charles Schwab, or Interactive Brokers give you access to global markets. Look for low fees, good research tools, and reliable mobile apps.
    2. ๐Ÿ’ณ Open and fund your account: Most brokerages let you start with any amount โ€” some allow fractional shares so you can buy $50 of Amazon even if a full share costs $180.
    3. ๐Ÿ” Find the stock: Every publicly traded company has a unique ticker symbol. Apple = AAPL. Microsoft = MSFT. Tesla = TSLA. Search by company name or ticker.
    4. ๐Ÿ“‹ Choose your order type: A market order buys at the current price. A limit order lets you set the maximum price you’re willing to pay. For beginners, market orders on liquid stocks are usually fine.
    5. โœ… Confirm and hold: Once your order executes, you’re a shareholder. Now comes the most important part โ€” staying patient.

    For a full walkthrough including how to evaluate brokers and avoid common mistakes, see our complete guide on how to invest in stocks.

    โš–๏ธ Stocks vs. Every Other Investment

    Context helps. How do stocks compare to the alternatives?

    ๐Ÿ  Stocks vs. Real Estate: Real estate builds wealth through appreciation and rental income, but requires large capital, involves illiquidity, and demands active management. Stocks are accessible with any amount, trade instantly, and require zero maintenance.

    ๐Ÿ“œ Stocks vs. Bonds: Bonds are loans โ€” you lend money to a company or government in exchange for fixed interest payments. Lower risk than stocks, but significantly lower returns over long periods. Most balanced portfolios hold both.

    ๐Ÿ’ต Stocks vs. Cash: Cash in a savings account is “safe” but loses purchasing power to inflation every year. At 3% inflation, your cash loses nearly a third of its value every decade. Stocks have historically outperformed inflation by 7โ€“8% annually after adjustment.

    โ‚ฟ Stocks vs. Crypto: Cryptocurrency offers high volatility and speculative upside but lacks the earnings-based fundamental value of stocks, has a much shorter history, and involves substantially higher regulatory and security risk. Some portfolios include a small crypto allocation as a speculative position alongside core stock holdings.

    ๐Ÿ… Stocks vs. Gold: Gold is a store of value and inflation hedge but generates no income. It doesn’t grow earnings or pay dividends โ€” it simply holds value over time. Stocks have massively outperformed gold over most long-term periods.

    ๐Ÿ“… The Long Game: Why Time Horizon Changes Everything

    The single most powerful force in stock investing isn’t stock-picking or market timing. It’s time.

    The S&P 500 โ€” a basket of 500 large US companies โ€” has returned approximately 10% annually on average since 1926. That means:

    • $10,000 invested for 10 years โ†’ ~$25,937
    • $10,000 invested for 20 years โ†’ ~$67,275
    • $10,000 invested for 30 years โ†’ ~$174,494

    No individual genius required. No market timing. Just consistent investment in diversified stocks over a long period. This is the mathematical foundation behind why financial advisors universally recommend starting early โ€” even with small amounts.

    Short-term, stocks are unpredictable. Long-term, they’ve been one of the most reliable wealth-building tools in history. Understanding this reality prevents the most expensive mistake investors make: selling during downturns and missing the recovery.

    ๐ŸŽฏ The Real Beginner’s Mistake (And How to Avoid It)

    Most beginner investors make one of two errors:

    Error 1 โ€” Waiting for the “perfect moment”: There’s always a reason to wait. Markets are “too high.” There’s political uncertainty. Recession fears. Inflation data. The truth: nobody consistently times the market. Time in the market beats time ing the market.

    Error 2 โ€” Concentrating in too few stocks: Putting everything into 2โ€“3 companies you “know” is exciting until one of them blows up. Diversification across sectors, company sizes, and geographies dramatically reduces single-company risk without sacrificing long-term returns.

    The antidote to both errors? A clear investment strategy matched to your goals and timeline. Our guide on stock investment strategies helps you build exactly that โ€” and our pillar resource on what stock investment is gives you the broader context for building real wealth.

    ๐Ÿ“ˆ Ready to Take the Next Step?

    Turn Knowledge Into Action

    You now understand what a stock is. The next step is knowing exactly how to invest โ€” step by step, without guesswork.

    โœ… Key Takeaways

    • ๐Ÿ”น A stock is fractional ownership in a real company โ€” not a number on a screen
    • ๐Ÿ”น Stocks make you money through price appreciation and dividends
    • ๐Ÿ”น Common stock gives voting rights and growth upside; preferred stock gives fixed income and priority
    • ๐Ÿ”น Stock prices move based on company earnings, macro conditions, and investor sentiment
    • ๐Ÿ”น Risk is real โ€” company failures, market crashes, and volatility all affect stock prices
    • ๐Ÿ”น Long holding periods dramatically reduce risk and amplify returns through compounding
    • ๐Ÿ”น Diversification is the most reliable protection against individual company failures

    Every sophisticated investor started by understanding exactly what you now understand. The next step isn’t waiting โ€” it’s starting, even small, and letting time do its work.

    ๐Ÿ” How to Evaluate a Stock Before You Buy

    Buying a stock because someone recommended it or because the name sounds familiar is how beginners lose money. Evaluating a stock before you buy it is how investors build lasting portfolios. Here’s a practical framework:

    Step 1: Understand the Business

    Can you explain in one or two sentences what this company does and how it makes money? If you can’t, you don’t understand it well enough to invest. Warren Buffett famously only buys businesses he understands completely. This principle alone eliminates most speculative disasters.

    Step 2: Check Revenue and Earnings Trends

    Is revenue growing year over year? Are earnings growing alongside revenue โ€” or is the company growing sales while losing money? Sustained revenue and earnings growth over 3โ€“5 years is one of the strongest signals of a healthy business.

    Step 3: Assess the Competitive Moat

    What stops competitors from copying this company’s business model and taking its customers? A strong moat โ€” brand loyalty (Apple), network effects (Visa), switching costs (Microsoft Office), or cost advantages โ€” protects earnings long-term. Companies without moats eventually see margins squeezed by competition.

    Step 4: Look at Valuation

    Even a great company can be a bad investment if you overpay. The P/E ratio is the starting point โ€” compare it to the company’s historical average, its industry peers, and the broader market. A P/E of 40 might be reasonable for a company growing earnings 30% annually; it would be alarming for a company growing at 5%.

    Step 5: Check the Balance Sheet

    Does the company carry excessive debt? High debt loads become dangerous when earnings fall or interest rates rise. Look for companies with manageable debt relative to their earnings (debt-to-EBITDA ratio) and healthy cash reserves.

    Step 6: Review Management

    Great businesses are built by great leaders. Has management delivered on its promises over time? Do executives own significant shares โ€” meaning they have skin in the game alongside regular investors? Are they honest and transparent in shareholder communications?

    This evaluation process takes time to develop but becomes faster and more intuitive with practice. For a structured approach to identifying strong investment candidates, see our guide on how to find the best stocks to invest in.

    ๐ŸŒ The Bigger Picture: Stocks and the Economy

    The stock market is often described as a “leading indicator” of the economy โ€” it tends to move before the broader economy does. This relationship is important to understand because it helps explain behavior that otherwise seems irrational.

    When investors expect the economy to grow, they buy stocks in anticipation of higher corporate earnings โ€” even before those earnings materialize. This is why markets often rise during economic recoveries before unemployment has fully recovered, and why they sometimes fall during seemingly good times when investors anticipate future slowdowns.

    This forward-looking nature of markets is why short-term prediction is so difficult. The market is always pricing in expectations about the future โ€” not just current reality. When reality differs from expectations (either better or worse), prices adjust โ€” sometimes violently.

    For long-term investors, this creates opportunities. When markets overreact to bad news and sell off fundamentally strong companies, patient investors can acquire ownership in great businesses at discounted prices. This is the foundation of value investing โ€” buying stocks when they’re priced below their intrinsic worth.

    ๐Ÿ“‹ Building Your First Stock Portfolio: Practical Principles

    Knowing what a stock is represents the foundation. Knowing how to build a portfolio that generates real returns โ€” without unnecessary risk โ€” is the next level. Here are the core principles:

    Diversification across companies: Own stocks in at least 10โ€“20 different companies across multiple sectors. If one company fails completely, it shouldn’t devastate your portfolio.

    Sector balance: Don’t over-concentrate in one sector. Technology has been the dominant sector for a decade โ€” but every sector eventually cycles through periods of underperformance. A balanced portfolio includes technology, healthcare, financials, consumer staples, industrials, and other sectors.

    Geographic diversification: US stocks have been exceptional performers, but they represent roughly 60% of global market capitalization. International diversification โ€” developed markets in Europe and Japan, emerging markets in Asia and Latin America โ€” provides exposure to different economic cycles and growth opportunities.

    Position sizing: No single stock should represent more than 5โ€“10% of your portfolio unless you have extraordinarily high conviction and risk tolerance. Concentration amplifies both gains and losses.

    Regular contributions: Dollar-cost averaging โ€” investing a fixed amount on a regular schedule regardless of market conditions โ€” removes the psychological burden of timing the market and ensures you buy more shares when prices are lower.

    These principles don’t guarantee profits, but they dramatically reduce the probability of catastrophic losses โ€” and create the conditions for long-term wealth accumulation. For a complete breakdown of investment approaches matched to different goals, read our in-depth guide on stock investment strategies.

  • How Does the Stock Market Work? The Invisible Auction Explained

    How Does the Stock Market Work? The Invisible Auction Explained

    Every day, billions of dollars change hands in milliseconds across computer networks that span the globe. Share prices flicker up and down like a living organism. Fortunes shift. Companies are valued and revalued in real time. And yet most people who participate in this system have only the vaguest idea of how it actually works underneath.

    That gap matters. Understanding the mechanics of how the stock market works โ€” not just “you buy low and sell high” but the actual infrastructure, incentives, and forces at play โ€” makes you a dramatically better investor. You stop being surprised by things that should be predictable. You start reading market behavior as information rather than noise.

    The best mental model: the stock market is an invisible, continuous auction house โ€” one that never closes, runs simultaneously across thousands of securities, and is attended by everyone from pension funds managing billions to individuals with a few hundred dollars. Your job as an investor is to understand the rules of this auction well enough to participate without being systematically exploited by those who know them better.

    The Architecture: What the Stock Market Actually Is

    Most people picture “the stock market” as a single place โ€” the famous trading floor with people shouting in colored jackets. That image is largely obsolete. The modern stock market is a distributed electronic network connecting buyers, sellers, brokers, market makers, and exchanges across thousands of servers worldwide.

    The Key Players

    Player Role How They Make Money
    Stock Exchanges
    (NYSE, NASDAQ)
    Provide the platform and rules for trading Listing fees + transaction fees
    Brokers
    (Fidelity, Schwab, Robinhood)
    Route your orders to the exchange Commissions, interest on cash, payment for order flow
    Market Makers
    (Citadel, Virtu)
    Quote both buy and sell prices simultaneously, providing liquidity Bid-ask spread captured millions of times per day
    Institutional Investors
    (BlackRock, Vanguard, hedge funds)
    Large-scale buyers/sellers of securities Fund management fees + investment returns
    Retail Investors
    (individual investors)
    Buy and hold for personal wealth building Capital appreciation + dividends
    Regulators
    (SEC, FINRA)
    Enforce rules, prevent fraud, ensure fair markets Government funded (enforcement fines)

    Understanding these players โ€” and their incentives โ€” clarifies a lot of seemingly mysterious market behavior. Market makers need volatility to profit. Brokers may have incentives to route your order to specific counterparties. Institutional investors move markets by their sheer size. Regulators move slowly but reshape the game over years.

    The Auction in Action: Price Discovery

    The core function of the stock market is price discovery โ€” the continuous process of determining what a security is worth right now, given all available information and the current balance of supply and demand.

    Here is how it happens mechanically:

    The Order Book

    At any moment, for any listed stock, an electronic order book maintains two lists:

    • Bid side: All buyers, ranked by the highest price they’re willing to pay
    • Ask side: All sellers, ranked by the lowest price they’re willing to accept

    The bid-ask spread is the gap between the highest bid and the lowest ask. When these two prices match โ€” a buyer meets a seller โ€” a trade executes.

    Example: Apple stock has a bid of $189.45 (the highest price anyone will currently pay) and an ask of $189.47 (the lowest price anyone will currently sell at). The $0.02 spread is captured by the market maker facilitating the transaction. When you place a market order, you immediately pay the ask or receive the bid โ€” you “cross the spread.”

    Types of Orders (And Why They Matter)

    Order Type How It Works Best Used When Risk
    Market Order Execute immediately at the best available price High-liquidity stocks, small position sizes Price slippage in volatile markets
    Limit Order Execute only at your specified price or better Most situations โ€” gives price control May not fill if price doesn’t reach your level
    Stop-Loss Order Triggers a market sell when price falls to specified level Risk management, protecting gains Can trigger during brief dips (whipsaws)
    Stop-Limit Order Triggers a limit sell when price hits stop level Precise exit management May not fill in fast-moving markets

    For most individual investors, limit orders are almost always preferable to market orders. A limit order costs you nothing extra and protects you from getting filled at a dramatically different price than expected โ€” which can happen in less liquid stocks or during volatile market conditions.

    How Stock Prices Actually Move: The Three Forces

    The auction metaphor helps explain how prices are set. But why do they move? Three distinct forces drive price changes:

    Force 1: Fundamental Reality Changes

    When a company’s actual business performance changes, its intrinsic value changes. Better earnings โ†’ higher justified valuation โ†’ price rises. Deteriorating margins โ†’ lower justified valuation โ†’ price falls. This is the slow, grinding force that dominates over years and decades.

    The key insight: fundamental changes are priced in immediately when they become public knowledge. Markets are highly efficient at incorporating new information into prices. This means that reading yesterday’s earnings report won’t help you trade today โ€” that information is already in the price the moment trading resumes.

    Force 2: Expectation Changes

    More powerful in the short term than actual results are changes in expectations. A company can report record profits and still see its stock fall 15% โ€” if those profits came in below what analysts expected. The market doesn’t price in reality; it prices in expectations of reality. The gap between expectation and outcome is what creates sharp price moves on earnings days.

    This is why “buy the rumor, sell the news” is a genuine market phenomenon. If positive news has been anticipated, the price often rises before the announcement and falls afterward โ€” not because the news was bad, but because it was already priced in.

    Force 3: Liquidity and Flow

    Sometimes prices move simply because large amounts of money need to enter or exit. When a pension fund rebalances, it might need to sell $500 million of equities โ€” not because anything changed about those companies, but because of allocation targets. When retail investors panic-sell during a crash, prices fall beyond fundamental justification simply because there are more forced sellers than buyers at any given moment.

    Understanding liquidity-driven moves prevents a common beginner mistake: assuming that every price movement reflects new information about company fundamentals. Often, it’s just the mechanics of who needs to buy or sell at that particular moment.

    Market Hours, Pre-Market, and After-Hours Trading

    The main US stock market session runs 9:30 AM to 4:00 PM Eastern Time, Monday through Friday (excluding US holidays). But trading doesn’t stop there:

    Session Hours (ET) Liquidity Who Should Use
    Pre-Market 4:00 AM โ€“ 9:30 AM Low โ€” wide spreads, thin volume Professionals reacting to overnight news
    Regular Session 9:30 AM โ€“ 4:00 PM High โ€” tightest spreads, most volume All investors โ€” best execution quality
    Power Hour 3:00 PM โ€“ 4:00 PM Very high โ€” institutional repositioning Traders who understand end-of-day dynamics
    After-Hours 4:00 PM โ€“ 8:00 PM Low โ€” wide spreads, thin volume Reacting to after-close earnings reports

    The opening 30 minutes (9:30โ€“10:00 AM) and the final hour (3:00โ€“4:00 PM) typically see the highest volume and volatility of the regular session. For most beginner investors, placing orders mid-day (10:30 AM to 2:30 PM) when spreads are tightest and volatility is lower will produce better execution than trading at the open or close.

    Indexes: The Market’s Report Card

    When someone says “the market was up 1.2% today,” they’re referring to a stock market index. Understanding what these indexes represent โ€” and their limitations โ€” prevents significant misreadings of market conditions.

    How Indexes Are Constructed

    The two main construction methods produce different results:

    • Market-cap weighted (S&P 500, NASDAQ): Larger companies have proportionally more influence. If Apple represents 7% of the S&P 500’s total market cap, a 5% move in Apple moves the index as much as a 5% move in the bottom 50 companies combined. This means index performance can be dominated by a handful of mega-caps.
    • Price-weighted (Dow Jones): Higher-priced stocks have more influence regardless of company size. A $500 stock affects the DJIA more than a $50 stock even if the $50 company is ten times larger by market cap. This methodology is outdated and a key reason why the DJIA is less useful than the S&P 500 as a market benchmark.

    What Indexes Don’t Tell You

    Indexes measure large-cap, publicly traded companies. They miss: private companies (SpaceX, Stripe), small businesses, real estate, commodities, and international markets. The S&P 500 being “up” doesn’t mean every stock is up โ€” in some bull markets, the majority of individual stocks actually decline while a small number of mega-caps drive the index higher.

    Stock market order book price discovery mechanism

    The Mechanics of Corporate Actions

    Beyond regular buying and selling, several corporate actions affect stock prices and your position as a shareholder:

    Stock Splits

    A stock split increases share count while proportionally reducing price โ€” the total value of your holding is unchanged. A 4-for-1 split means each $400 share becomes four $100 shares. Companies split stocks primarily to improve liquidity and accessibility. Apple (AAPL) has split multiple times, most recently 4-for-1 in 2020.

    Dividends and Ex-Dividend Dates

    When a company declares a dividend, four dates matter:

    • Declaration Date: The board announces the dividend amount
    • Ex-Dividend Date: You must own the stock before this date to receive the dividend
    • Record Date: The company records who qualifies (typically 1 business day after ex-div)
    • Payment Date: Cash is distributed to eligible shareholders

    On the ex-dividend date, the stock price typically drops by approximately the dividend amount โ€” because buyers after this date won’t receive the upcoming dividend. This is mechanical, not fundamental.

    Share Buybacks

    When companies repurchase their own shares, they reduce the share count. With fewer shares outstanding, each remaining share represents a larger ownership slice โ€” earnings per share increases without earnings actually changing. Buybacks are often more tax-efficient than dividends for shareholders because they don’t trigger a taxable event unless you sell.

    Market Efficiency: What It Means for You

    The Efficient Market Hypothesis (EMH) is one of the most studied and debated ideas in finance. In its strongest form, it claims that all available information is instantly reflected in stock prices, making it impossible to consistently “beat the market.”

    The practical implication for investors:

    • Weak form efficiency: Technical analysis of past prices cannot consistently predict future prices. Confirmed by most academic research.
    • Semi-strong form efficiency: Publicly available fundamental information is quickly priced in. This explains why most active fund managers underperform index funds over 15+ years.
    • Strong form efficiency: Even private information is priced in. This is false โ€” insider trading prosecutions confirm that non-public information can provide trading advantages (and is illegal for that reason).

    The practical takeaway: don’t expect to consistently outperform the market based on publicly available information. The investors who beat the market long-term typically have either genuine informational edge (deep industry expertise), behavioral advantages (ability to hold through extreme volatility), or structural advantages (access to private investments unavailable to most).

    The Role of Emotions in Market Mechanics

    The textbook version of market mechanics assumes rational actors making efficient decisions. The real version includes the full range of human psychology amplified by crowds and media.

    The Fear and Greed Cycle is the emotional engine that creates market bubbles and crashes:

    1. Optimism: Markets rise. Investors feel validated. Early cautioners look foolish.
    2. Excitement: Prices accelerate. Friends and media talk about stocks. FOMO increases.
    3. Euphoria: Everyone “knows” prices will keep rising. Risk feels irrelevant. This is typically the market peak.
    4. Anxiety: Prices begin falling. Investors tell themselves it’s temporary.
    5. Denial: “It’ll bounce back.” Losses mount but selling feels like accepting defeat.
    6. Panic: Fear dominates. Selling accelerates regardless of price. This is often near the market bottom.
    7. Capitulation and Depression: Investors who held finally give up and sell at the worst possible time.
    8. Disbelief: Prices begin recovering but investors don’t trust it โ€” they’ve been burned.
    9. The cycle repeats from Optimism.

    Knowing where you are in this cycle doesn’t let you time the market perfectly. But it does allow you to recognize when you’re being driven by emotion rather than analysis โ€” and to make decisions accordingly.

    Clearing and Settlement: The 48-Hour Handshake You Never See

    When you click “Buy” and see your portfolio update instantly, it feels like the transaction is complete. It isn’t. The confirmation you see is just a promise. The actual transfer of ownership and cash happens through a back-office process called clearing and settlement โ€” and understanding it explains some quirks that confuse beginner investors.

    T+2 Settlement

    Most US stock trades settle on a T+2 basis โ€” meaning the transaction officially completes two business days after the trade date. If you buy stock on Monday (T), the shares are officially transferred to your account and the cash is officially transferred to the seller on Wednesday (T+2).

    Why does this matter practically? A few reasons:

    • Selling immediately after buying: You can see the shares in your account and sell them before settlement, but margin requirements may apply if you lack the cash balance
    • Dividend eligibility: You must own stock before the ex-dividend date โ€” which is determined by settlement, not trade date
    • Cash availability: When you sell stock, the cash isn’t immediately available for withdrawal โ€” it becomes available after T+2 settlement (though many brokers let you use unsettled funds to buy other securities)

    Who Handles Clearing?

    The Depository Trust & Clearing Corporation (DTCC) is the central clearing infrastructure for US markets โ€” handling approximately $2.4 quadrillion in securities transactions annually. It acts as the central counterparty for both sides of every trade, eliminating the risk that either party defaults before settlement completes. This infrastructure is largely invisible to individual investors but is a critical piece of why markets work reliably at scale.

    Short Selling: Profiting from Falling Prices

    Most investors profit when prices rise. Short sellers profit when prices fall โ€” and understanding short selling illuminates a mechanism that affects prices you’ll encounter as a long investor.

    How Short Selling Works

    1. Short seller borrows shares from a broker (who borrows them from long-term holders)
    2. Short seller sells the borrowed shares at the current price
    3. If price falls as expected, short seller buys shares back at a lower price
    4. Returns borrowed shares to broker, keeps the difference (minus borrowing costs)
    5. If price rises instead, short seller faces unlimited theoretical losses

    Short sellers play a valuable role in market efficiency โ€” they act as a check on overvalued companies and fraud. Famous short sellers like Carson Block (Muddy Waters) and Jim Chanos have exposed accounting fraud at companies like Enron and Luckin Coffee. When a heavily shorted stock suddenly surges, short sellers must buy shares to cover โ€” creating a short squeeze that dramatically amplifies the price move (as seen with GameStop in January 2021).

    Options, Futures, and Derivatives: What They Are (And Whether You Need Them)

    Beyond buying stocks outright, financial markets offer derivatives โ€” contracts whose value is derived from an underlying asset. A brief orientation is useful even if you never trade them, because derivatives activity significantly affects the underlying stock market.

    Instrument What It Is Who Typically Uses It Risk Level
    Call Option Right to buy shares at a fixed price before expiration Speculators betting on price rise; income sellers High (buyer can lose 100% of premium)
    Put Option Right to sell shares at a fixed price before expiration Hedgers protecting against decline; speculators High (similar to calls)
    Futures Contract Obligation to buy/sell an asset at a set price on a set date Institutions, commodities producers, speculators Very high (leveraged, obligatory)
    ETF (Leveraged) Fund that multiplies daily index returns (2x, 3x) Short-term traders only Very high (volatility decay destroys long-term value)

    For beginning and intermediate investors, the recommendation is clear: avoid derivatives until you have significant experience and a specific, well-understood reason to use them. The leverage they provide amplifies losses as reliably as gains, and most retail options traders lose money. Focus on building a solid foundation with direct stock ownership or index funds first.

    Market Microstructure: Why Your Trade Gets Routed Where It Does

    One piece of market mechanics that rarely gets explained to retail investors โ€” but directly affects your returns โ€” is payment for order flow (PFOF).

    Here is what happens when you place a trade on most commission-free brokers:

    1. Your order goes to your broker (Robinhood, Webull, etc.)
    2. Instead of routing directly to an exchange, your broker sends it to a market maker (Citadel Securities, Virtu)
    3. The market maker pays the broker for this order flow
    4. The market maker fills your order, typically at a price slightly worse than the best available exchange price โ€” but better than the quoted spread
    5. The market maker keeps the difference between what they paid for your order and the spread they captured

    PFOF is controversial. Proponents argue retail investors still get better prices than they could execute directly. Critics argue it creates a conflict of interest: brokers are incentivized to route orders to whoever pays the most, not whoever gives you the best execution. The SEC has proposed rules requiring brokers to demonstrate “best execution” for all orders.

    The practical implication: for large trades, it’s worth comparing execution quality across brokers. Fidelity and Interactive Brokers have historically shown better execution quality on large trades than commission-free apps that rely heavily on PFOF revenue.

    Global stock market connections and trading

    Global Markets and How They Affect US Stocks

    The stock market doesn’t operate in isolation. US equities are deeply connected to global financial systems, and understanding these linkages helps explain seemingly random price movements that have nothing to do with individual company performance.

    Overnight Gaps: Why Stocks Open at Different Prices

    While US markets are closed (4:00 PM to 9:30 AM ET), significant events can occur globally โ€” Japanese economic data releases, European central bank decisions, geopolitical events, or major corporate announcements. US stock futures trade nearly 24 hours, reflecting these overnight developments. This is why stocks often open at a notably different price than where they closed the previous day: the market is “catching up” to information that developed while the regular session was closed.

    Currency Effects

    For multinational companies, currency fluctuations directly affect reported earnings. A strong US dollar means that revenue earned in euros, yen, or pounds converts to fewer dollars when reported. This is why US multinationals often report “constant currency” revenue growth figures alongside regular GAAP results โ€” stripping out currency effects to show underlying business performance.

    Correlation and Contagion

    Global markets are increasingly correlated. A financial crisis in Europe, a growth slowdown in China, or a sovereign debt problem in emerging markets can trigger selling across US equities even when US economic fundamentals are healthy. This “contagion” effect is driven by institutional investors managing global portfolios who sell liquid US assets to cover losses elsewhere, and by the general risk-off sentiment that spreads when global financial stability is threatened.

    For long-term investors, these international contagion events are typically buying opportunities rather than signals of fundamental US deterioration. The 2011 European debt crisis, for example, caused significant US stock market volatility despite US corporate earnings remaining strong throughout โ€” and was followed by one of the longest bull markets in US history.

    Ready to Apply This Knowledge?

    Start Your Investment Journey Today

    You now understand the mechanics behind every trade. The next step is putting that knowledge to work with a clear strategy and your first investment.

    Putting It All Together: What Smart Investors Do Differently

    Understanding market mechanics changes how you act in three concrete ways:

    1. You use limit orders, not market orders. You know the order book exists and that market orders cross the spread unnecessarily in most situations. Limit orders cost nothing and improve your execution price.

    2. You ignore short-term price movements. You understand that most daily fluctuations are noise โ€” liquidity flows, sentiment shifts, and random variation rather than new information about business fundamentals. Long-term investors who understand this check their portfolios monthly, not daily.

    3. You buy when others panic. You recognize the Fear and Greed Cycle for what it is. When markets are in panic and fear is peaking, you know from history that this is often the best time to invest more โ€” not to sell. The counterintuitive action is usually the correct one.

    The stock market rewards those who understand it. That understanding starts exactly here โ€” with the mechanics of how prices are set, how trades execute, and how human psychology shapes everything in between.

    For the full picture on getting started, read our guides on what stock investment is and our complete beginner’s guide to the stock market.

  • Stock Market for Beginners: Everything You Need to Know Before Your First Investment

    Stock Market for Beginners: Everything You Need to Know Before Your First Investment

    The stock market can feel like a foreign country with its own language, customs, and rules โ€” confusing at first, but completely learnable once someone shows you the map. This guide is that map.

    By the end of this article, you will understand how the stock market actually works, why prices move, what drives long-term returns, and the key concepts every beginner needs before investing a single dollar. No jargon left unexplained. No assumptions about prior knowledge.

    What Is the Stock Market?

    The stock market is a network of exchanges where buyers and sellers trade ownership stakes in public companies. When a company wants to raise money from the public, it sells shares โ€” small pieces of ownership โ€” through a process called an Initial Public Offering (IPO). After that initial sale, investors trade those shares with each other on exchanges like the New York Stock Exchange (NYSE) or NASDAQ.

    The price of each share is set in real time by supply and demand: when more people want to buy a stock than sell it, the price rises. When more want to sell than buy, the price falls.

    Two key things to understand from the start:

    • You are not gambling in a casino. When you buy stock, you own a real piece of a real business. If that business grows and becomes more profitable, your investment grows in value. The stock market is a mechanism for sharing in the wealth that businesses create.
    • The market is a long-term wealth machine with short-term volatility. The S&P 500 โ€” a benchmark index of America’s 500 largest companies โ€” has returned approximately 10% annually on average since 1926. In any given year, it can swing wildly. Over any 20-year period in history, it has never lost money.

    Key Stock Market Terms Every Beginner Must Know

    Before going further, here are the essential terms you’ll encounter constantly:

    Term Simple Definition
    Stock / Share A unit of ownership in a company
    Stock Exchange A marketplace where stocks are bought and sold (NYSE, NASDAQ)
    Stock Index A benchmark tracking a group of stocks (S&P 500, Dow Jones, NASDAQ Composite)
    Bull Market A sustained period of rising stock prices (up 20%+ from recent lows)
    Bear Market A sustained period of falling stock prices (down 20%+ from recent highs)
    Market Cap Total value of a company’s outstanding shares (Price ร— Number of shares)
    Dividend A portion of company profits paid to shareholders, typically quarterly
    Portfolio Your complete collection of investments
    Broker The intermediary platform that executes your buy/sell orders
    Volatility How much a stock’s price fluctuates โ€” higher volatility means bigger swings
    Liquidity How easily a stock can be bought or sold without significantly affecting its price
    IPO Initial Public Offering โ€” when a company first sells shares to the public

    How Stocks Make Money for Investors

    Stocks generate returns in two ways:

    1. Capital Appreciation

    Capital appreciation is the increase in a stock’s price over time. If you buy a stock at $50 and it rises to $80, your $30 gain is capital appreciation. This happens when: the company grows its earnings, the market becomes more optimistic about the company’s future, or both.

    Over the long run, capital appreciation is driven primarily by earnings growth. A company that consistently grows profits at 12% annually will see its stock price track that growth over time, even with short-term divergences in either direction.

    2. Dividends

    Dividends are cash payments made by companies to shareholders, typically quarterly. Not all companies pay dividends โ€” many growth companies reinvest all profits back into the business. But dividend-paying companies, especially those with long histories of increasing dividends, provide a steady income stream alongside any price appreciation.

    The total return of a stock investment equals capital appreciation plus dividends reinvested. Historically, dividends have accounted for roughly 40% of the stock market’s total long-term return โ€” a fact many beginners overlook when they focus exclusively on price movements.

    Understanding Stock Market Indexes

    You’ll hear constant references to “the market” being up or down. What does that mean? It refers to major stock market indexes:

    • S&P 500: Tracks 500 large US companies across all major sectors. This is the most widely used benchmark for US stock market performance. When financial media says “the market was up 1% today,” they almost always mean the S&P 500.
    • Dow Jones Industrial Average (DJIA): Tracks 30 large US companies. Historically important but less representative than the S&P 500 because it only covers 30 stocks and uses a price-weighted methodology.
    • NASDAQ Composite: Tracks all stocks listed on the NASDAQ exchange โ€” heavily weighted toward technology companies. A useful gauge of tech sector performance.
    • Russell 2000: Tracks 2,000 smaller US companies (small-cap stocks). Useful for gauging the health of the broader economy beyond large corporations.

    Why Stock Prices Move

    Understanding why prices change is the key to developing realistic expectations. Stock prices move for three main reasons:

    Company-Specific News

    Earnings reports, product launches, management changes, mergers, regulatory decisions โ€” any news specific to a company will affect its stock price. Strong earnings typically cause a price jump; missed earnings typically cause a drop. The magnitude depends on how much the news differed from what investors were expecting. A company can report record profits but still see its stock fall if the profits came in below analyst expectations.

    Macroeconomic Factors

    Interest rates, inflation, GDP growth, unemployment โ€” these broad economic forces affect all stocks simultaneously. Rising interest rates are particularly important: they make bonds more attractive (competing with stocks), increase borrowing costs for companies, and reduce the present value of future earnings. This is why the Federal Reserve’s rate decisions are so closely watched by stock market investors.

    Investor Sentiment and Psychology

    Markets are driven by human psychology as much as fundamentals. Fear and greed create cycles of overvaluation and undervaluation. During bull markets, investors become increasingly optimistic, bidding prices above fundamental value. During bear markets, fear dominates, pushing prices below fundamental value. These emotional swings create both risk and opportunity โ€” the investor who can stay rational when markets are most emotional has a significant structural advantage.

    The Risk-Return Relationship

    One of the most fundamental concepts in investing: higher potential returns require accepting higher risk. This isn’t a market design choice โ€” it’s a mathematical necessity. If a “safe” investment reliably produced the same returns as a risky one, everyone would shift to the safe option until prices equalized.

    Investment Type Historical Annual Return Typical Worst Year Recovery Time
    Cash / Savings Account 1โ€“3% Near 0% Immediate
    Government Bonds 3โ€“5% -5% to -15% 1โ€“2 years
    S&P 500 Index ~10% -38% (2008) 3โ€“5 years
    Individual Growth Stocks Variable (can be 20%+) -50% to -80% Varies widely

    The practical implication: only invest in stocks money you won’t need for at least 3โ€“5 years. Short time horizons mean you might need to sell during a downturn, locking in losses before the market recovers.

    Compound interest long-term investment growth

    The Power of Compounding

    Compounding is why time in the market matters more than timing the market. Compounding means earning returns on your returns โ€” your investment snowball grows larger and faster the longer it rolls.

    A concrete example with 10% annual returns:

    Years Invested $10,000 Initial + $200/month Total Contributed Investment Gain
    10 years $52,400 $34,000 $18,400
    20 years $162,800 $58,000 $104,800
    30 years $452,000 $82,000 $370,000
    40 years $1,184,000 $106,000 $1,078,000

    At 40 years, you contributed $106,000 but the market made you a millionaire. That extra $1,078,000 came entirely from compounding โ€” returns earning returns earning returns. This is why starting early matters dramatically more than starting with more money.

    Types of Stocks: What You’ll Actually Buy

    Not all stocks are created equal. Understanding the major categories helps you build a portfolio appropriate for your goals:

    By Company Size (Market Cap)

    • Large-cap (above $10B): Stable, well-established companies like Apple, Microsoft, JPMorgan. Lower growth potential but lower risk. Ideal for conservative investors and portfolio cores.
    • Mid-cap ($2Bโ€“$10B): Companies in growth phases. More volatility than large-caps but higher growth potential.
    • Small-cap (below $2B): Early-stage or niche companies. Highest potential returns but also highest risk and lower liquidity.

    By Investment Style

    • Growth stocks: Companies growing revenues and earnings rapidly, typically reinvesting all profits rather than paying dividends. Higher P/E ratios, higher risk, higher potential returns.
    • Value stocks: Companies trading below their estimated intrinsic value โ€” often mature businesses temporarily out of favor. Lower P/E ratios, less exciting, but historically strong long-term returns.
    • Dividend stocks: Companies that return consistent cash to shareholders. Attractive for income-seeking investors; often defensive during market downturns.
    • Index funds / ETFs: Not individual stocks, but funds tracking indexes. Provide instant diversification at low cost. The baseline recommendation for most beginners.

    Common Beginner Mistakes to Avoid

    Most of the painful lessons in stock market investing are avoidable. Here are the ones beginners make most often:

    • Waiting for the “right time” to invest: Time in the market consistently beats timing the market. Research shows that investing a lump sum immediately outperforms waiting for a dip in roughly 70% of historical cases. Start now, even if conditions feel uncertain.
    • Checking your portfolio daily: Daily price movements are noise. Obsessively monitoring your portfolio leads to emotional decisions and trading at exactly the wrong times. Check your portfolio monthly at most.
    • Selling during market crashes: Every major market crash in history โ€” 1987, 2000, 2008, 2020 โ€” eventually fully recovered and went higher. Investors who sold during those crashes locked in losses and missed the recoveries. The right response to a crash is typically to hold or buy more, not sell.
    • Concentrating in one stock or sector: A single stock going to zero can wipe out years of gains from other investments. Diversification isn’t just theory โ€” it’s the main tool individual investors have to protect against being catastrophically wrong about a single company.
    • Chasing hot tips and trending stocks: By the time a stock appears on Reddit or a news headline, the sophisticated investors have already positioned. Retail investors following trends typically buy at the peak of enthusiasm, just before the price falls.
    Stock market cycle phases bull bear market visualization

    Understanding Market Cycles

    The stock market moves in cycles โ€” alternating periods of expansion (bull markets) and contraction (bear markets). Understanding these cycles doesn’t mean you can time the market, but it does help you maintain perspective when the news is either irrationally exuberant or catastrophically pessimistic.

    The Four Market Cycle Phases

    • Accumulation: The cycle begins after a market bottom. Informed, long-term investors recognize undervaluation and begin buying while most of the public is still pessimistic. Prices move sideways to slightly up. Trading volume is low.
    • Markup (Bull Market): Prices begin rising consistently. Optimism spreads. More investors enter the market. Media coverage turns positive. This phase can last years and produces the majority of long-term market gains.
    • Distribution: Prices reach a peak as early buyers begin selling to late arrivals. The market feels most exciting and optimistic at exactly this moment. Volatility increases. Sophisticated investors reduce risk; retail investors pile in.
    • Markdown (Bear Market): Prices fall 20%+ from recent highs. Fear dominates. Bad news accelerates selling. This is psychologically the most difficult phase for investors โ€” and paradoxically, the phase that creates the best future buying opportunities.

    The critical insight: the most pessimistic moments in markets are historically the best times to invest, and the most optimistic moments are when you should be most cautious. This runs directly against human psychology, which is why most retail investors underperform the market averages they could easily match with index funds.

    Historical Bear Markets in Context

    Bear Market S&P 500 Decline Duration Recovery to New High
    Dot-com crash (2000-2002) -49% 2.5 years 5 years
    Financial crisis (2007-2009) -57% 1.5 years 4 years
    COVID crash (2020) -34% 33 days 5 months
    Inflation bear (2022) -25% 9 months 18 months

    Every bear market in history ended. Every recovery exceeded the previous peak. The investors who held through the declines captured the full return; those who sold locked in permanent losses.

    Tax-Advantaged Accounts: Where to Hold Your Stocks

    In most countries, investment returns are taxed. The account you use to hold your investments can significantly affect your after-tax returns. In the United States, two main tax-advantaged account types are available to individual investors:

    401(k) / Employer Retirement Plans

    A 401(k) allows you to invest pre-tax money โ€” reducing your taxable income today โ€” with taxes deferred until withdrawal in retirement. Many employers match contributions up to a certain percentage. An employer match is a guaranteed 50-100% return on that portion of your investment, making it the first place every investor should direct money.

    Individual Retirement Account (IRA)

    A Roth IRA allows after-tax contributions, but all future growth and withdrawals are completely tax-free. For younger investors in lower tax brackets, the Roth IRA is one of the most powerful long-term investment tools available. A Traditional IRA works like a 401(k) โ€” pre-tax contributions, taxed on withdrawal.

    The general priority order for new investors:

    1. Contribute to 401(k) up to employer match (free money)
    2. Max out Roth IRA ($7,000/year as of 2024)
    3. Return to 401(k) up to annual limit ($23,000/year as of 2024)
    4. Taxable brokerage account for additional investments

    Reading the Market: Basic Tools for Beginners

    You don’t need to be a professional analyst to make informed investment decisions. A few basic tools provide the most useful signal:

    Earnings Reports

    Every public company reports earnings quarterly. The report includes revenue, earnings per share, and management guidance for future quarters. Earnings reports are the single most important recurring event that drives individual stock prices. Key things to check: did they beat or miss analyst expectations? What did management say about the next quarter? Is the trend improving or deteriorating?

    The Price-to-Earnings (P/E) Ratio

    The P/E ratio is the most widely used valuation metric. It shows how many dollars investors are paying per dollar of annual earnings. A P/E of 20 means you’re paying $20 for $1 of earnings. The S&P 500 average P/E has historically ranged from 10 to 25, with 15-18 considered “fair value” in most economic conditions.

    The 52-Week High/Low

    Every stock’s trading page shows the 52-week high (highest price in the past year) and 52-week low (lowest). This range provides quick context: a stock near its 52-week low might be undervalued โ€” or it might be declining for good reasons. A stock near its 52-week high might be overvalued โ€” or it might be a momentum leader worth watching. Context always matters.

    Building Your First Investment Philosophy

    As you learn more about investing, you’ll develop a personal investment philosophy โ€” a clear set of principles guiding your decisions. The most important elements to define early:

    • Your time horizon: Short-term investors and long-term investors should hold completely different portfolios. Be honest about when you’ll actually need your money.
    • Your risk tolerance: Not abstract “how much risk can you afford” but specific “how would I respond if my portfolio dropped 40% next month?” If the honest answer is “I’d sell everything,” your allocation needs to be more conservative.
    • Your strategy commitment: Pick an approach โ€” index-first, value, dividend, growth โ€” and commit to it through at least one full market cycle before evaluating whether to adjust. Strategy-hopping after every downturn guarantees underperformance.
    • Your information diet: Limit financial news consumption. Daily market commentary is designed to keep you engaged, not to make you a better investor. Quarterly or semi-annual deep reviews of your portfolio are more valuable than daily monitoring.

    The best investment philosophy is one you can stick to consistently. A theoretically optimal strategy abandoned during a crash produces worse outcomes than a slightly suboptimal strategy executed with discipline for 20 years.

    How to Start Investing in the Stock Market

    The mechanics of getting started are simpler than most beginners expect:

    1. Open a brokerage account: Fidelity, Charles Schwab, and Vanguard are the gold-standard platforms for long-term investors โ€” low costs, good tools, excellent customer service. For active traders, platforms like Interactive Brokers offer more sophisticated tools.
    2. Start with index funds: Before buying individual stocks, consider allocating a core position to a total market index fund (like Vanguard’s VTI or Fidelity’s FZROX). This gives you immediate diversification while you learn.
    3. Define your time horizon and risk tolerance: If you need the money in 2 years, keep it in cash or bonds. If you have 20+ years, you can tolerate significant equity exposure. Being honest about your actual risk tolerance prevents panic-selling during downturns.
    4. Set up automatic contributions: Automate a monthly investment โ€” even $100/month โ€” so you invest consistently regardless of market conditions or emotional state.
    5. Keep learning continuously: The more you understand businesses, industries, and economic cycles, the better investment decisions you’ll make over time.

    If you’re ready to take the next step, our guide on how to invest in stocks step by step covers the account setup and first purchase process in detail. And when you’re evaluating specific companies, the stock investment strategies guide will help you choose the approach that fits your goals and personality.

    The stock market rewards the patient, the disciplined, and the informed. You’re already building all three by reading this.

    Want to understand the mechanics behind every price move? Read our deep-dive on how the stock market works โ€” order books, price discovery, and the invisible auction explained.

    ๐Ÿ“š P5 Deep Dive

  • Best Stocks to Invest In: A Framework for Choosing Winning Companies

    Best Stocks to Invest In: A Framework for Choosing Winning Companies

    Every new investor eventually asks the same question: which stocks should I actually buy? With over 6,000 publicly traded companies in the US alone, the choice feels overwhelming. Most beginners either freeze up entirely or chase whatever stock appeared on a news headline that morning.

    Both approaches lose money. This guide gives you a better one: a systematic framework for evaluating what makes a stock worth investing in โ€” not a list of specific tickers (those change), but a repeatable process you can apply to any company, in any market, at any time.

    Here’s the core insight experienced investors use: there are no universally “best” stocks โ€” only stocks that are best for a specific investor at a specific price at a specific time. The framework below helps you find yours.

    Why Stock Lists Are a Trap (And What to Use Instead)

    A quick search for “best stocks to invest in” returns thousands of articles listing specific ticker symbols. There’s a fundamental problem with every single one of them: by the time you read it, the information is priced in.

    Markets are remarkably efficient at incorporating publicly available information into prices. If a stock genuinely represented an obvious opportunity, millions of investors would already have bought it, driving the price up until the opportunity disappeared. The stocks on those “best stocks” lists are often stocks that were great investments โ€” before the article was written.

    What actually works is a framework for independent evaluation. When you can assess any company’s quality and value yourself, you don’t need lists. You become the source.

    The 5-Factor Stock Evaluation Framework

    Strong stock investments share five characteristics. Not every great stock has all five, but the more boxes a company checks, the better the risk-adjusted potential.

    Factor 1: Business Quality

    Before any financial metric, ask: do I understand how this company makes money? Warren Buffett calls this staying within your “circle of competence.” If you can’t explain a company’s business model in two sentences, you probably shouldn’t invest in it.

    Characteristics of high-quality businesses:

    • Durable competitive advantage (moat): Something that protects profits from competition. This can be brand loyalty (Apple, Coca-Cola), network effects (Visa, Mastercard), switching costs (Salesforce, Adobe), or cost advantages (Costco, Amazon).
    • Pricing power: Can the company raise prices without losing customers? Companies with genuine pricing power outperform during inflationary periods.
    • Recurring revenue: Subscription businesses, software contracts, and consumer staples generate more predictable cash flows than one-time product sales.
    • Asset-light model: Companies that generate high returns without needing massive capital reinvestment (like software companies) are structurally more attractive than capital-intensive industries (like airlines or steel).

    Factor 2: Financial Health

    Even great businesses can be bad investments if they’re financially fragile. Check these metrics before investing:

    Metric What It Measures Healthy Range Red Flag
    Debt-to-Equity Ratio How leveraged the company is Below 1.0 for most industries Above 2.0 (except banks/utilities)
    Current Ratio Ability to pay short-term obligations Above 1.5 Below 1.0
    Interest Coverage Ratio Can earnings cover debt interest? Above 3x Below 1.5x
    Free Cash Flow Real cash generated after capex Consistently positive Negative for 3+ years
    Return on Equity (ROE) Profit generated per dollar of shareholder equity Above 15% Below 8% consistently

    Free cash flow is the most important single number. Earnings can be manipulated through accounting choices; free cash flow is much harder to fake. A company consistently generating strong free cash flow can survive recessions, fund growth, and return money to shareholders โ€” regardless of short-term earnings volatility.

    Stock fundamental analysis metrics and financial statements

    Factor 3: Growth Trajectory

    A stock’s future price reflects expectations of future cash flows. Understanding a company’s growth trajectory โ€” and how sustainable that growth is โ€” determines whether today’s price is attractive or expensive.

    Key growth questions:

    • Revenue growth rate: What has it been over 3โ€“5 years? Is it accelerating, stable, or decelerating?
    • Earnings per share (EPS) growth: Is the company growing profits, or just revenue? Revenue without earnings growth often signals structural margin problems.
    • Total Addressable Market (TAM): How much room to grow is left? A company at 2% market penetration in a $500B market has very different prospects than one at 60% penetration in a $10B market.
    • Reinvestment rate: What percentage of earnings does management reinvest back into the business? High-quality companies often reinvest at high rates of return, compounding value over time.

    Factor 4: Valuation

    Even the world’s best business is a bad investment if you pay too much for it. Valuation determines your starting point โ€” and your starting point determines your eventual return.

    The most useful valuation metrics for stock investors:

    Metric Formula Use When Limitation
    P/E Ratio Price / Earnings per share Profitable, stable companies Distorted by one-time items
    PEG Ratio P/E / Annual EPS growth rate Growth companies Relies on growth estimates
    EV/EBITDA Enterprise Value / EBITDA Comparing across capital structures Ignores capex requirements
    Price/Free Cash Flow Market cap / Annual FCF Cash-generative businesses Doesn’t work for pre-cash flow companies
    Price/Sales (P/S) Market cap / Annual revenue Pre-profit high-growth companies Ignores profitability completely

    The PEG ratio is especially useful for evaluating growth stocks. A P/E of 30 sounds expensive โ€” but if the company is growing earnings at 30% annually, the PEG is 1.0, which most analysts consider fairly valued. A P/E of 15 with 5% earnings growth has a PEG of 3.0 โ€” actually more expensive on a growth-adjusted basis.

    Always compare valuations to: (1) the company’s own historical range, (2) industry peers, and (3) the broader market. A stock trading at a 40% discount to its 5-year average P/E deserves more investigation than one trading at a 40% premium.

    Factor 5: Management Quality

    Numbers tell you what happened. Management tells you what will happen. The best financial metrics in the world can deteriorate quickly under poor leadership; mediocre fundamentals can transform under exceptional management.

    How to evaluate management without knowing them personally:

    • Capital allocation track record: How has management deployed cash over the past 5โ€“10 years? Acquisitions at reasonable prices, disciplined share buybacks when stock is undervalued, and dividends funded by genuine cash flow are positive signals.
    • Insider ownership: CEOs and founders with significant personal wealth tied to the stock have aligned incentives. Executives who sell large proportions of their holdings continuously are a yellow flag.
    • Return on Invested Capital (ROIC) over time: ROIC above the company’s cost of capital means management is creating value with shareholder money. ROIC below cost of capital means they’re destroying it.
    • Candor in shareholder letters: Management that acknowledges failures honestly, explains strategy clearly, and avoids overuse of “adjusted” non-GAAP metrics tends to be more trustworthy than those who don’t.

    Types of Stocks Worth Considering

    Applying the 5-factor framework across the market, certain categories historically produce strong long-term investment candidates:

    Quality Compounders

    Quality compounders are businesses that consistently grow earnings at 12โ€“20%+ annually, maintain high ROIC (above 15%), have durable competitive advantages, and can reinvest profits at those high rates for long periods. These are the “wonderful companies at fair prices” Buffett described โ€” the goal is to find them early and hold them for decades.

    Historical examples of compounders (not investment advice): Visa grew revenue 11% annually and ROIC above 30% for 15 years. Microsoft returned to compounder status under Satya Nadella’s leadership with Azure cloud growth.

    Dividend Growers

    Companies with 10โ€“25+ consecutive years of dividend increases often have the business stability and capital discipline that makes them reliable long-term holdings. The Dividend Aristocrats (25+ years of increases) and Dividend Kings (50+ years) are institutional-quality screens for business durability.

    Turnarounds With Catalysts

    Sometimes a quality business hits a temporary problem โ€” a product recall, a management transition, a sector rotation โ€” and trades at a significant discount to intrinsic value. These turnaround situations can offer exceptional returns if: (1) the problem is genuinely temporary, (2) the underlying business quality remains intact, and (3) a clear catalyst for recovery is visible.

    The risk: what looks like a temporary problem is often the early sign of a structural decline. Disciplined position sizing is essential for turnaround plays.

    Sector Leaders in Secular Growth Industries

    Some industries are in the early stages of multi-decade growth curves. Dominant companies within those sectors can compound returns for very long periods. Identifying secular growth trends early โ€” cloud computing in 2010, electric vehicles in 2015, AI infrastructure in 2020 โ€” and owning the sector leaders through their growth phases is one of the most powerful long-term investment approaches.

    What to Avoid: The Anti-Portfolio Checklist

    Knowing what NOT to buy is at least as valuable as knowing what to buy. Avoid these red flags:

    Red Flag Why It Matters
    Consistent negative free cash flow beyond 3 years The business isn’t self-sustaining; relies on continuous external financing
    Debt-to-equity above 3x in cyclical industries High leverage + cyclical revenues = bankruptcy risk in downturns
    Revenue growth driven primarily by acquisitions Organic growth is real; acquisition-driven “growth” often destroys value
    Management consistently missing their own guidance Either incompetent at forecasting or not being honest with shareholders
    Auditor changes or qualified audit opinions Serious financial reporting concern; sell or avoid until resolved
    Business model that requires constant explanation “If it can’t be explained simply, it isn’t understood fully” โ€” complexity hides risk
    Stocks in the news for exciting narratives, not fundamentals Story stocks are priced for perfection; any disappointment causes severe drops

    The Research Process: How to Actually Evaluate a Stock

    Applying the framework requires a research process. Here’s how to go from zero knowledge to an informed buy/don’t-buy decision on any company:

    Step 1: Read the Annual Report (10-K)

    Every US-listed public company files an annual report with the SEC. The 10-K contains everything: business description, risk factors, financial statements, management discussion. Start with the risk factors section โ€” management is legally required to disclose known risks. Then read the Management Discussion and Analysis (MD&A) section to understand how leadership interprets the numbers.

    Step 2: Check 5-Year Financial Trends

    Pull revenue, gross margin, operating margin, free cash flow, and debt levels for the past 5 years. Are they stable, improving, or deteriorating? Trends tell you more than any single-year snapshot. A company with slightly below-average margins that has been consistently improving for 4 years is often more interesting than one with great current margins that have been declining.

    Step 3: Understand the Competitive Landscape

    Who are the top 3 competitors? What are their key differentiators from this company? Has market share been stable, growing, or shrinking? Industry reports, earnings call transcripts (free on Seeking Alpha or directly from company IR pages), and competitor 10-Ks often give the clearest picture of competitive dynamics.

    Step 4: Assess Valuation vs. History and Peers

    Calculate the company’s current P/E, P/FCF, and EV/EBITDA. Compare to: its own 5-year average, its closest 2โ€“3 competitors, and the S&P 500 average. A premium to history and peers requires a specific justification โ€” accelerating growth, improving margins, a new product cycle.

    Step 5: Determine Your Thesis and the Risk That Would Break It

    Write one paragraph explaining exactly why you think this stock will outperform over your time horizon. Then write one paragraph describing the specific scenario that would prove your thesis wrong. This “pre-mortem” approach forces clarity and gives you a clear exit signal if circumstances change.

    Stock portfolio diversification across sectors

    Building a Stock Portfolio: Diversification Rules

    Even the best individual stock analysis carries uncertainty. Diversification is how you protect against being right on the framework but wrong on a specific company.

    Practical diversification guidelines for individual stock investors:

    • Minimum 15โ€“20 stocks across different sectors to achieve meaningful diversification
    • No more than 10% in any single stock for most investors (5% maximum for higher-risk positions)
    • No more than 25โ€“30% in any single sector โ€” sector concentration amplifies cyclical risk
    • Geographic diversification: Consider 10โ€“20% allocation to international stocks for exposure to different economic cycles

    If individual stock selection feels too complex or time-consuming, remember: the evidence consistently shows that a diversified low-cost index fund outperforms the majority of active stock pickers over 15+ years. There is no shame โ€” and considerable wisdom โ€” in combining individual stock research with a substantial index fund core.

    Using Stock Screeners to Find Candidates

    A stock screener is a tool that filters the entire market by specific financial criteria, reducing thousands of options to a manageable shortlist. Free screeners like Finviz, Yahoo Finance Screener, and Macrotrends are sufficient for most individual investors.

    A Practical Screening Template

    Here is a starting-point screen designed to surface quality companies at reasonable valuations. Adjust thresholds based on your strategy:

    Filter Minimum Maximum Rationale
    Market Cap $2B (mid-cap) No limit Reduces micro-cap liquidity risk
    P/E Ratio 5 35 Filters distressed and wildly expensive stocks
    5-Year Revenue Growth 8% annually No limit Confirms sustained business growth
    Return on Equity 15% No limit Screens for capital-efficient businesses
    Debt-to-Equity 0 1.5 Eliminates over-leveraged companies
    Dividend Growth (optional) 5+ consecutive years N/A Signals business stability and cash generation

    A typical screen using these filters might return 30-80 companies from the S&P 500. That is a manageable research list — not a buy list. Every company that passes the screen still requires the 5-factor evaluation before any investment decision.

    Sector-by-Sector Considerations

    Different sectors require different evaluation criteria. Using a one-size-fits-all valuation framework across all industries produces misleading conclusions.

    • Technology: Price-to-sales and EV/revenue matter more than P/E for early-stage companies. Look for gross margins above 60% and accelerating revenue growth. Network effects and switching costs are the most defensible moats.
    • Healthcare and Pharmaceuticals: Pipeline depth matters as much as current revenue. Patent expiration dates are critical risk factors. Evaluate FDA approval probability realistically — most drugs in clinical trials fail.
    • Consumer Staples: Focus on brand strength, pricing power, and distribution. Consistent dividend growth over 10+ years is a reliable quality signal. Relatively low P/E multiples are normal and not necessarily cheap.
    • Financial Services: Banks and insurance companies require different metrics: return on assets (ROA), return on equity (ROE), net interest margin, and loan loss reserves. Debt ratios that look alarming in other industries are normal for banks by design.
    • Energy: Commodity-price sensitivity means the sector is inherently cyclical. Evaluate companies on break-even oil prices and capital discipline through the full cycle, not just during high-price periods.
    • Real Estate (REITs): Use Funds from Operations (FFO) instead of earnings — depreciation charges distort net income for property owners. Dividend sustainability is the primary valuation concern.

    Common Mistakes First-Time Investors Make

    Understanding the framework is step one. Avoiding the psychological traps that undermine even well-researched decisions is step two.

    Recency bias: Assuming last year’s best-performing stocks will continue outperforming. Mean reversion is one of the most powerful forces in markets — sectors and strategies that dramatically outperform in one period tend to underperform in the next.

    Confirmation bias: Researching a company you already want to own and selectively weighting information that confirms your thesis. Force yourself to find the three strongest arguments against any stock before buying it.

    Loss aversion and anchoring: Refusing to sell a losing position because “it needs to come back to what I paid for it.” The market doesn’t know what you paid. Evaluate every position as if you were deciding whether to buy it today at today’s price. If you wouldn’t buy it today, consider selling it.

    Over-trading: Research consistently shows that more frequent trading leads to lower returns for individual investors due to transaction costs, taxes, and the tendency to buy high and sell low during emotional episodes. Most great long-term investments are held through multiple uncomfortable periods.

    Ignoring position sizing: Putting 30% of your portfolio into one speculative idea based on a “sure thing” thesis. Even the most conviction-worthy ideas carry uncertainty. The investors who survive and thrive long-term are those who manage downside, not just upside.

    Ready to Find Your Stocks?

    The framework above won’t generate a quick list of tickers. It does something more valuable: it gives you a repeatable system for evaluating any stock in any market condition. Applied consistently, it filters out most bad investments before they cost you money and helps identify genuinely attractive opportunities when they appear.

    If you’re still building your foundational knowledge, start with our guides on what stock investment is and how it works and how to set up your account and make your first investment. Once you understand the mechanics and have chosen your investment strategy, come back to this framework whenever you’re evaluating a specific company.

    The best investors aren’t the ones who find the best stocks โ€” they’re the ones with the best process. Build the process first.

    New to investing altogether? Our comprehensive stock market guide for beginners explains how the market works, why prices move, and the key concepts to know before your first investment.

    ๐Ÿ“š Deep Dive: P4 Learning Group

  • Stock Investment Strategies: The 5 Approaches Every Investor Needs to Know

    Stock Investment Strategies: The 5 Approaches Every Investor Needs to Know

    You’ve learned what stocks are. You’ve opened your brokerage account. Now comes the real question every investor eventually faces: how exactly do you grow your money in the stock market?

    The answer depends on which weapon you choose from the investor’s arsenal. Stock market investing isn’t one-size-fits-all โ€” there are five distinct strategies, each with its own logic, temperament requirement, and expected payoff curve. Choose the wrong one for your personality and you’ll panic-sell at the worst moment. Choose the right one and you’ll stay the course when markets get ugly.

    This guide breaks down every major stock investment strategy, the evidence behind each, and the honest tradeoffs you need to understand before committing real money.

    Why Strategy Matters More Than Stock Picks

    Most beginners obsess over finding “the right stock.” Experienced investors obsess over process. Research consistently shows that asset allocation and strategy selection explain over 90% of long-term portfolio variance โ€” not individual stock selection.

    Think of it this way: a value investor and a growth investor can own completely different portfolios yet both outperform the market over 20 years โ€” because each followed a disciplined, internally consistent strategy rather than chasing whatever was hot last quarter.

    Before we dig in, here’s a quick orientation of what’s coming:

    Strategy Core Idea Time Horizon Risk Level Best For
    Value Investing Buy underpriced stocks 3โ€“10+ years Medium Patient contrarians
    Growth Investing Buy high-potential companies 3โ€“7 years Mediumโ€“High Optimists with strong stomach
    Dividend Investing Buy income-generating stocks 5โ€“20+ years Lowโ€“Medium Income seekers, retirees
    Index Investing Buy the whole market 10โ€“30 years Market-level Everyone (baseline strategy)
    Momentum Investing Buy what’s going up Weeksโ€“months High Active traders, high conviction

    Strategy 1: Value Investing โ€” The Art of Buying $1 for $0.70

    Value investing is the strategy popularized by Benjamin Graham and perfected (publicly, at least) by Warren Buffett. The core premise is simple: stock prices frequently diverge from a company’s intrinsic value. When they diverge downward โ€” when a stock trades for less than what the business is actually worth โ€” a buying opportunity emerges.

    How Value Investing Works

    Value investors evaluate stocks through fundamental metrics:

    • Price-to-Earnings (P/E) ratio: How much you pay per dollar of earnings. A P/E of 10 is cheaper than a P/E of 30, all else equal.
    • Price-to-Book (P/B) ratio: Stock price vs. the company’s net asset value. Below 1.0 suggests trading below liquidation value.
    • Free Cash Flow Yield: Annual free cash flow divided by market cap. Higher is better โ€” it means the business generates real cash relative to its price.
    • Debt-to-Equity ratio: A heavily indebted company may look cheap but carry hidden risk.

    The goal is finding companies with low valuations + solid fundamentals โ€” businesses temporarily out of favor with Mr. Market, not businesses that are permanently broken.

    The Margin of Safety Concept

    Graham’s most important idea: always buy with a margin of safety. If you calculate a stock’s intrinsic value at $100, only buy at $70 or below. That $30 buffer protects you if your analysis is slightly wrong (and it often is).

    Real Returns: Does Value Investing Work?

    The historical evidence is compelling. Fama-French research shows that value stocks (low P/B) have historically outperformed growth stocks by approximately 3โ€“4% annually over long periods. However, value investing had a notorious “lost decade” from 2010โ€“2020 when growth stocks dominated. The evidence suggests value investing works โ€” but requires patience measured in years, not months.

    Value Investing Tradeoffs

    Pros Cons
    Historical long-term outperformance Can underperform for years (“value trap” risk)
    Built-in downside protection via margin of safety Requires deep fundamental analysis
    Lower volatility than growth stocks Boring โ€” no exciting stories to tell at parties
    Warren Buffett’s proven track record Individual stock selection is genuinely hard

    Best suited for: Investors willing to do company-level research, comfortable owning “boring” businesses, and able to hold positions for 3โ€“7+ years regardless of short-term price movements.

    Value investing vs growth investing comparison

    Strategy 2: Growth Investing โ€” Betting on the Future

    Growth investing focuses on companies expected to grow revenues and earnings significantly faster than the broader market. You’re not buying cheap โ€” you’re buying potential. Amazon at 100x earnings in 2005. Netflix before streaming was mainstream. NVIDIA before AI.

    What Makes a Growth Stock

    Growth investors look for:

    • Revenue growth rate: Consistently 20%+ annually is the baseline for serious growth candidates
    • Total Addressable Market (TAM): Is the opportunity massive? A company growing 30% in a tiny market will hit a ceiling fast
    • Competitive moat: Network effects, switching costs, patents โ€” something that protects the growth rate from competition
    • Management quality: Founder-led companies with skin in the game tend to outperform
    • Gross margins: High gross margins (60%+) fund growth; low margins constrain it

    The Price You Pay for Growth

    Growth stocks typically trade at high valuations โ€” P/E ratios of 30, 50, even 100+. This isn’t necessarily irrational. A company growing earnings at 40% per year will “grow into” a high multiple quickly. The danger: if growth disappoints even slightly, the stock can fall 40โ€“60% as the multiple compresses simultaneously with slowing earnings.

    This dual-compression effect is why growth investing is more volatile than it appears. In 2022, many high-growth tech stocks fell 60โ€“80% as interest rates rose and growth projections were revised downward.

    Growth Investing Tradeoffs

    Pros Cons
    Massive upside when you’re right Extreme volatility โ€” 50%+ drawdowns common
    Exciting, high-conviction investing Very expensive when market is optimistic
    Aligns with innovation and market disruption Difficult to distinguish real moats from hype
    Winners can compound returns for decades Most “hot” companies disappoint eventually

    Best suited for: Investors with a 5โ€“10 year horizon, high risk tolerance, ability to hold through 40โ€“60% drawdowns without selling, and genuine interest in researching business models and competitive dynamics.

    Strategy 3: Dividend Investing โ€” Getting Paid While You Wait

    Dividend investing focuses on companies that return a portion of profits to shareholders regularly โ€” typically quarterly. Instead of relying purely on price appreciation, you’re building a portfolio that generates cash flow regardless of what the stock price does on any given Tuesday.

    The Compounding Engine

    The real power of dividend investing isn’t the dividend itself โ€” it’s dividend reinvestment (DRIP). When you reinvest dividends to buy more shares, which then generate more dividends, which buy more shares… you’re running a compounding machine that accelerates over time.

    A classic example: $10,000 invested in a basket of Dividend Aristocrats (companies with 25+ consecutive years of dividend increases) in 2000, with dividends reinvested, would have grown to approximately $67,000 by 2023 โ€” a 570% return while the S&P 500 returned roughly 480% total over the same period.

    Key Metrics for Dividend Investors

    • Dividend Yield: Annual dividend / stock price. A 3% yield means $3,000/year per $100,000 invested. Caution: yields above 6โ€“7% often signal trouble โ€” the price may have fallen because the dividend is at risk.
    • Payout Ratio: Dividends paid / net earnings. Below 60% is generally safe; above 80% raises sustainability questions.
    • Dividend Growth Rate: Consistent 5โ€“10% annual dividend growth beats a high static yield over time
    • Dividend Coverage Ratio: Free cash flow / dividends paid. Should be at least 1.5x for comfort.

    Dividend Aristocrats vs High-Yield Traps

    The S&P 500 Dividend Aristocrats index tracks companies with 25+ consecutive years of dividend increases. These include Johnson & Johnson, Coca-Cola, Procter & Gamble, and Realty Income. Their consistent dividend growth signals underlying business strength.

    Contrast this with “high yield traps” โ€” companies offering 8โ€“12% yields that subsequently cut dividends when earnings decline. A dividend cut typically causes the stock to fall 20โ€“30% immediately, eliminating years of yield benefit in a single day.

    Dividend Investing Tradeoffs

    Pros Cons
    Regular income stream regardless of price Often misses high-growth secular winners
    Dividend Aristocrats are quality-screened businesses Dividends taxed as income (vs deferred capital gains)
    Psychologically easier โ€” you get paid to wait Lower total return ceiling than pure growth
    Natural inflation hedge if dividends grow High-yield stocks are often value traps

    Best suited for: Income-focused investors, retirees or near-retirees, anyone who wants to “feel” their portfolio working through regular cash deposits, and investors with longer time horizons who will reinvest dividends.

    Dividend investing passive income compounding

    Strategy 4: Index Investing โ€” The Humble Strategy That Beats Most Pros

    Here’s a fact that shocks most new investors: over 15 years, more than 88% of actively managed large-cap US funds underperform the S&P 500 index (SPIVA report, 2023). Not slightly underperform โ€” most of them lose to a simple, automated, low-cost index fund.

    Index investing is the strategy of buying a fund that tracks a broad market index โ€” S&P 500, total market, global markets โ€” rather than trying to pick individual winners. You own a tiny slice of every company in the index.

    Why Index Investing Wins

    • Cost advantage: Index ETFs charge 0.03โ€“0.20% annually. Active funds charge 0.5โ€“1.5%. Over 30 years, that difference compounds into a massive return gap.
    • Diversification: You own 500 companies (S&P 500) or thousands (total market). One bankruptcy doesn’t hurt you.
    • Behavioral advantage: Nothing to research = nothing to second-guess = fewer emotional decisions
    • Tax efficiency: Low turnover means fewer taxable events each year

    Core Index Investing Portfolio Examples

    Portfolio Type Allocation Expected Volatility
    100% Equity 80% Total Market + 20% International High (but highest long-term return)
    Balanced 60% Stocks + 40% Bonds Medium
    Conservative 40% Stocks + 60% Bonds Lowโ€“Medium
    3-Fund Portfolio US Total Market + International + Bond fund Adjustable by allocation

    The One Honest Limitation

    Index investing guarantees you’ll never beat the market โ€” because you are the market. If you’re motivated by market-beating returns, index investing will feel intellectually unsatisfying. But the data is clear: the vast majority of people who try to beat the market over 15+ years don’t. Index investing turns that uncomfortable fact into a strategy advantage.

    Best suited for: Everyone as a baseline. Particularly valuable for investors who don’t want to spend time researching stocks, those with long time horizons (retirement accounts), and anyone who has been burned by overconfident stock picking in the past.

    Strategy 5: Momentum Investing โ€” Riding the Wave

    Momentum investing is built on a counterintuitive but empirically documented phenomenon: stocks that have performed well over the past 3โ€“12 months tend to continue outperforming in the near term. Winners keep winning. Losers keep losing. Until they don’t.

    The Academic Evidence

    Momentum is one of the most thoroughly documented market anomalies in financial research. Jegadeesh and Titman (1993) first demonstrated that buying 6-month winners and shorting 6-month losers produced significant excess returns. This has been replicated across markets and time periods.

    The behavioral explanation: investors underreact to good news initially (anchoring to the old price), then overreact later as more investors pile in. Momentum investors try to profit from this gap between initial underreaction and eventual full repricing.

    Practical Momentum Approaches

    • Relative momentum: Buy the top 20% of stocks by 6-month or 12-month return; sell when they drop out of the top tier
    • Absolute momentum: Only hold stocks when their returns exceed a risk-free rate (cash/T-bills); otherwise hold cash. This provides a bear market filter.
    • Sector rotation: Rotate into the strongest sectors each quarter โ€” a less granular version of stock-level momentum

    The Critical Risk: Momentum Crashes

    Momentum’s achilles heel is the “momentum crash.” When markets reverse sharply โ€” as in March 2009 or the early 2020 COVID recovery โ€” momentum strategies can lose 30โ€“50% in weeks as yesterday’s leaders become tomorrow’s laggards in violent reversals. Momentum requires disciplined sell rules and position sizing.

    Momentum Investing Tradeoffs

    Pros Cons
    Documented academic factor premium Severe crash risk at market turning points
    Works across asset classes, not just stocks High turnover = high taxes + transaction costs
    No fundamental analysis required Psychologically difficult โ€” requires selling laggards (emotionally feel like “buying high”)
    Can be systematized and automated Requires constant monitoring and rebalancing

    Best suited for: Systematic, rules-based investors who can detach emotionally from positions, those with shorter time horizons (months to 1โ€“2 years), and investors who understand tax-efficient account structures for frequent trading.

    Risk Management Across All Strategies

    Regardless of which strategy you choose, risk management is the foundation that keeps you in the game long enough to let any strategy work. Markets don’t care about your investment thesis โ€” they will test your conviction repeatedly.

    Position Sizing

    Position sizing is how much of your portfolio you allocate to any single stock. Most professional investors follow a simple rule: no single position should exceed 5-10% of your portfolio. Even the most confident value investor caps individual stock positions, because every analysis carries uncertainty.

    Index investors don’t face this problem — the fund handles diversification automatically. But active stock pickers, whether growth or value focused, must be disciplined about position concentration. A single 30% position that goes to zero eliminates years of gains in other positions.

    Dollar-Cost Averaging (DCA)

    Dollar-cost averaging means investing a fixed amount at regular intervals — say $500 every month — regardless of market conditions. When prices are high, you buy fewer shares. When prices are low, you buy more. Over time, this produces a lower average cost per share than trying to time the market.

    The behavioral benefit of DCA is underrated: it removes the paralysis of waiting for the “right time” to invest. Every major bull market in history started at a moment when the news seemed terrible. DCA keeps you investing through that noise.

    Month Stock Price $500 Invested Shares Bought
    January $50 $500 10.0
    February $40 $500 12.5
    March $30 $500 16.7
    April $45 $500 11.1
    Total Avg $41.25 $2,000 50.3 shares

    In the example above, the average price was $41.25 but you actually paid an average of $39.76 per share ($2,000 / 50.3) — $1.49 below the average price simply by investing consistently.

    Rebalancing

    Rebalancing means periodically returning your portfolio to its target allocation. If your target is 70% stocks / 30% bonds and a bull market pushes you to 85% stocks, you sell some stocks and buy bonds to rebalance. This forces you to sell high and buy low systematically — without any market timing ability required.

    Most financial advisors recommend annual or semi-annual rebalancing. More frequent rebalancing increases transaction costs without meaningfully improving outcomes.

    Stop Loss vs. Stay the Course

    One of the sharpest debates in investing: should you use stop-loss rules, or simply hold through drawdowns?

    For index investors: almost never use stop losses. Every major market crash in history eventually recovered, and selling during a crash locks in losses permanently. The 2008 crash, the 2020 COVID crash, the 2022 bear market — all recovered within 1-3 years.

    For momentum investors: stop losses are essential. Momentum strategies must cut losers quickly — that is the core mechanism. Without stop losses, a momentum strategy devolves into a “buy and hold whatever was hot” strategy, which combines the worst of all worlds.

    For value and growth investors: it depends on conviction. If your original thesis is intact, a 30% price decline is often a buying opportunity, not a sell signal. If the thesis has broken (management fraud discovered, competitive moat destroyed, industry disruption accelerated), sell without hesitation.

    Combining Strategies: The Core-Satellite Approach

    Most sophisticated investors don’t choose just one strategy โ€” they build a core-satellite portfolio that combines strategies by their strengths:

    Component Allocation Strategy Purpose
    Core 60โ€“70% Index funds Market returns, low cost, stable base
    Satellite A 15โ€“20% Dividend stocks Income generation, defensive tilt
    Satellite B 10โ€“15% Growth or value picks Potential alpha, active engagement
    Tactical 0โ€“10% Momentum or opportunistic Active opportunities when conviction is high

    The core ensures you capture market returns. The satellites give you the opportunity to outperform โ€” or at least to actively engage with your portfolio โ€” without betting the whole account on your stock-picking ability.

    Which Stock Investment Strategy Is Right for You?

    The honest answer is: start with index investing, no matter what. It requires no research, it works, and it gives you time to learn what actually interests you about markets. Then, as you develop genuine interest in specific strategies, allocate a portion of your portfolio to explore them โ€” value, growth, or dividend โ€” while keeping the index core intact.

    Here’s a simple decision framework:

    • Have less than 30 minutes per week for investing? โ†’ Index only. Don’t overcomplicate it.
    • Want income now? โ†’ 60% index + 40% dividend stocks
    • Excited about specific industries or companies? โ†’ 70% index + 30% growth or value picks
    • Have a trading background and enjoy active management? โ†’ Core-satellite with a momentum satellite

    The worst strategy is the one you can’t stick to. A slightly suboptimal strategy you execute consistently will outperform an optimal strategy you abandon during the first 30% market correction.

    Next Steps

    Now that you understand the major stock investment strategies, you’re ready to move from theory to execution. Two things matter most at this stage:

    1. Pick a primary strategy aligned with your time horizon, temperament, and available research time
    2. Start investing โ€” even if imperfectly. Time in market beats perfect timing every single time.

    If you haven’t yet set up your brokerage account, read our guide on how to invest in stocks step by step. And if you’re still building foundational knowledge about what stocks actually are and how they work, start with our complete stock investment beginner’s guide.

    The market rewards the disciplined and the patient. Pick your strategy. Stay consistent. Let compounding do the heavy lifting.

    When applying these strategies to real companies, use the 5-factor stock evaluation framework to identify the strongest candidates for each approach.

    New to investing altogether? Our comprehensive stock market guide for beginners explains how the market works, why prices move, and the key concepts to know before your first investment.

  • How to Invest in Stocks: A Complete Step-by-Step Guide for Beginners

    How to Invest in Stocks: A Complete Step-by-Step Guide for Beginners

    How to Invest in Stocks: A Complete Step-by-Step Guide for Beginners

    Learning how to invest in stocks is one of the highest-leverage financial skills you can develop. Done correctly, stock investment turns ordinary income into extraordinary long-term wealth through the mathematics of compound returns. Done incorrectly โ€” through emotional trading, stock picking without research, or high-fee products โ€” it burns both money and confidence.

    This guide gives you the complete, honest, step-by-step process for investing in stocks as a beginner. No jargon. No shortcuts. No promises of fast money. Just the system used by millions of ordinary investors to build real wealth over time.

    ๐Ÿ’ก Before You Begin: Successful stock investing is not about picking the next Apple or timing market crashes. It’s about consistently putting money into well-diversified, low-cost investment vehicles and leaving it alone long enough for compounding to work. The 7-step process below is based on that principle.

    โšก Quick Summary: 7 Steps to Invest in Stocks

    1. Assess your financial situation (debt, emergency fund, goals)
    2. Choose your account type (brokerage, Roth IRA, 401k)
    3. Open an account with a reputable broker
    4. Select your investments (index funds for most beginners)
    5. Deposit money and place your first trade
    6. Set up automatic recurring investments (dollar-cost averaging)
    7. Monitor annually โ€” rebalance and stay the course

    Step 1: Assess Your Financial Situation First

    Before you invest a single dollar in stocks, you need to ensure your financial foundation is solid. Stocks are long-term investments โ€” the money you put into them should be money you don’t need for at least 5 years, ideally 10+. Investing money you might need next year forces you to sell at the worst possible time (usually during market downturns when you’re most financially stressed).

    The Financial Foundation Checklist

    Prerequisite Target Why It Matters
    Emergency fund 3โ€“6 months expenses in savings Prevents forced selling during downturns
    High-interest debt Zero credit card / personal loan debt above 7% 10% stock return means nothing if paying 18% on debt
    Employer 401k match Contribute enough to capture full match Free 50โ€“100% instant return on contributions
    Investment timeline 5+ years before you need the money Stocks can decline 40%+ short-term; time heals

    If you have high-interest debt, pay it off before investing in stocks. A credit card charging 22% interest is a guaranteed 22% loss on every dollar that stays on the card. No stock investment offers a reliable 22% return. Eliminate that debt first, then redirect those payments into investments.

    Step 2: Choose Your Account Type

    This is the most important tax decision you’ll make as an investor. Different account types have different tax advantages, contribution limits, and withdrawal rules. Choosing the wrong account type can cost you tens of thousands of dollars over a lifetime.

    Account Types Explained

    Account Type Tax Treatment 2024 Limit Best For
    401(k) Pre-tax (pay tax on withdrawal) $23,000 First priority (especially with employer match)
    Roth IRA After-tax (withdrawals tax-free) $7,000 Second priority; best for long-term compounders
    Traditional IRA Pre-tax (pay tax on withdrawal) $7,000 Alternative to Roth if expecting lower tax bracket in retirement
    Taxable Brokerage No tax advantages; pay capital gains tax Unlimited After maxing tax-advantaged accounts; flexible

    The recommended priority order:

    1. 401(k) up to employer match (free money first)
    2. Roth IRA up to annual limit ($7,000 in 2024)
    3. Back to 401(k) up to annual limit ($23,000)
    4. Taxable brokerage for additional savings

    The Roth IRA is particularly powerful for younger investors. You contribute after-tax dollars, but all growth and withdrawals in retirement are completely tax-free. If you invest $7,000/year in a Roth IRA for 30 years with 10% average returns, you accumulate over $1.2 million โ€” and every dollar of withdrawal in retirement is tax-free income.

    7-step staircase investing journey for stock market beginners

    Step 3: Open a Brokerage Account

    Opening a brokerage account is simpler than opening a bank account. The entire process takes 5-15 minutes online. Here’s what to look for and how to do it.

    What to Look for in a Broker

    • Zero commission on stock and ETF trades โ€” All major brokers offer this now. Non-negotiable.
    • No account minimum โ€” You should be able to open with any amount
    • Access to index funds and ETFs โ€” Particularly their own low-cost index funds
    • SIPC insurance โ€” Protects your account up to $500,000 if the brokerage fails
    • Fractional shares โ€” Ability to buy partial shares of expensive stocks like Amazon or Google

    Top Brokers for Beginners

    Broker Best Feature Signature Fund Account Min
    Fidelity Best overall; ZERO fee index funds FZROX (0.00% ER) $0
    Vanguard Pioneer of index investing; investor-owned VTSAX (0.04% ER) $0 ETF / $3,000 mutual fund
    Charles Schwab Excellent research tools; fractional shares SCHB (0.03% ER) $0
    Interactive Brokers Best for international investors Access to global markets $0

    For most US-based beginners, Fidelity is the best choice โ€” zero-fee index funds (literally 0.00% expense ratio), no account minimum, excellent mobile app, and outstanding customer service.

    For international investors, Interactive Brokers offers the best combination of low fees, global market access, and regulatory coverage across 150+ countries.

    Opening Your Account: Step by Step

    1. Visit the broker’s website and click “Open an Account”
    2. Choose your account type (Individual Brokerage or Roth IRA for most beginners)
    3. Enter personal information: name, address, Social Security Number (for US residents), date of birth
    4. Answer suitability questions about your investment experience and goals
    5. Link your bank account for transfers
    6. Verify your identity (upload ID photo in most cases)
    7. Wait 1-3 business days for approval

    Step 4: Select Your Investments

    This is where most beginners overthink. The research is clear: for most investors, a simple two or three-fund portfolio of low-cost index ETFs outperforms complex actively managed strategies over the long run.

    The Simple Two-Fund Portfolio (Recommended for Most Beginners)

    • 70-80%: US total market fund โ€” VOO (S&P 500), VTI (US total market), or FZROX (zero fee)
    • 20-30%: International fund โ€” VXUS (international total market) or FZILX

    That’s it. Two funds. Rebalance once a year. This portfolio holds thousands of companies across the entire global economy. You own a slice of everything.

    โœ… Why This Works: Vanguard’s research shows that the global stock portfolio (US + international stocks, market-cap weighted) captures essentially all the risk premium available to equity investors. Adding bonds reduces volatility but also expected returns. For young investors with decades ahead, keeping it in stocks maximizes long-term wealth accumulation.

    Adding Bonds for Stability

    If you’re over 50, closer to retirement, or simply can’t stomach watching your portfolio drop 40% during bear markets, add a bond allocation:

    • Age 30-40: 80% stocks / 20% bonds (AGG or BND)
    • Age 40-50: 70% stocks / 30% bonds
    • Age 50-60: 60% stocks / 40% bonds
    • Retirement: 40-50% stocks / 50-60% bonds

    Bonds act as shock absorbers โ€” they tend to hold value or even rise during stock market crashes, giving you stability and rebalancing fuel when stocks are cheap.

    Step 5: Place Your First Trade

    Once your account is funded, placing your first trade is straightforward. Log into your broker, search for the ETF symbol (e.g., “VOO”), and click “Buy.” You’ll see:

    • Market order: Buy immediately at the current price. Fine for most investors.
    • Limit order: Specify the maximum price you’ll pay. Useful for individual stocks, rarely necessary for ETFs.
    • Number of shares: How many units to purchase. If you have $1,000 and VOO is $480/share, buy 2 shares (if fractional shares available, you can invest the exact dollar amount).

    Click “Review Order,” confirm the details, and submit. Your first stock investment is complete. The transaction settles in 1-2 business days, and the shares will appear in your account.

    Dollar cost averaging vs waiting for perfect timing: consistent monthly investing wins over 20 years

    Step 6: Set Up Automatic Recurring Investments

    The most important habit in stock investing is consistency. Set up automatic monthly transfers from your bank account to your brokerage account, then automatic monthly purchases of your target funds.

    Most modern brokers support automatic investing โ€” you set it up once and it runs indefinitely without any action from you. This implements dollar-cost averaging automatically: you invest $500 (or whatever amount) monthly regardless of market conditions.

    The mathematical impact of consistency:

    Monthly Investment 10 Years (10% returns) 20 Years 30 Years
    $200/month $38,600 $151,900 $452,000
    $500/month $96,500 $379,700 $1,131,000
    $1,000/month $193,000 $759,400 $2,261,000
    $2,000/month $386,000 $1,518,800 $4,522,000

    Notice: the jump from 20 years to 30 years is much larger than the jump from 10 to 20. This is compounding’s hockey-stick effect. Every year you stay invested, the growth accelerates.

    Step 7: Annual Review and Rebalancing

    Once per year โ€” on New Year’s Day, your birthday, or any fixed date โ€” review your portfolio. This review has three goals:

    1. Check allocation: Has your US/international split drifted significantly from your target? If target is 75/25 but now it’s 82/18, rebalance.
    2. Increase contributions: Have you received a raise? Increase monthly contributions by 50% of the raise.
    3. Stay the course: Confirm you’re not making emotional decisions based on recent market performance.

    Rebalancing is mechanical: sell the outperformer (which is now “expensive”), buy the underperformer (which is now “cheap”). This is the opposite of what emotions tell you to do โ€” which is exactly why the rule exists.

    In tax-advantaged accounts, rebalancing has no tax consequences. In taxable brokerage accounts, you can often rebalance by directing new contributions to the underweight asset rather than selling, which avoids triggering capital gains.

    โ›” The One Rule That Overrides Everything: Do not sell during market crashes. In 2009 (after 50% crash), investors who sold locked in catastrophic losses. Investors who held โ€” or bought more โ€” made everything back within 3 years and went on to triple their money in the next decade. Market crashes are temporary. Selling at the bottom is permanent.

    ๐ŸŽ“ What to Do When You’re More Confident

    After 1-2 years of consistent investing with a simple index fund portfolio, you might feel ready to explore more. Here are sensible next steps โ€” in order of recommendation:

    1. Optimize tax efficiency: Learn asset location (which investments belong in which account type for maximum after-tax returns). This is free money through tax optimization.

    2. Add a factor tilt: Research suggests value stocks and small-cap stocks have historically delivered premium returns. Adding a small allocation (10-20%) to VBR (Vanguard Small Cap Value) or AVUV (Avantis US Small Cap Value) can enhance long-term returns.

    3. Individual stocks (as a satellite): If you want to research and own individual company stocks, keep it to 10% or less of your portfolio. Treat it as the speculative satellite around your passive core. Never let individual stock picking become more than 10-15% of your total investment.

    4. Real estate through REITs: Adding 5-10% in a REIT index fund (VNQ) provides real estate exposure with the liquidity of stocks.

    But here’s the honest truth: none of these additions will meaningfully outperform the simple two-fund portfolio for most investors. Simplicity wins. The marginal return of complexity rarely justifies the additional cognitive load and trading costs.

    ๐Ÿšจ The 7 Biggest Mistakes New Investors Make

    1. Waiting for the “right time” โ€” Markets are at all-time highs frequently. If you wait for a crash, you might wait 10 years and miss massive gains. The best time to invest was yesterday. The second best time is today.

    2. Checking your portfolio daily โ€” This is how emotion destroys strategy. Daily checking leads to reactive trading. Check monthly at most; annually is better.

    3. Trying to pick individual winning stocks โ€” 95% of professional fund managers fail to beat the S&P 500 index over 20 years. Your odds are worse. Use index funds.

    4. Chasing performance โ€” Last year’s top-performing sector almost always underperforms next year. Don’t buy what already ran. Stick to your allocation.

    5. Paying high fees โ€” A 1% annual fee sounds small. Over 30 years on a $100,000 investment, it costs you over $100,000 in lost compounding. Use funds with expense ratios under 0.10%.

    6. Selling during crashes โ€” This is the most expensive mistake. It turns temporary paper losses into permanent real losses, and means you miss the recovery. Hold through volatility.

    7. Not investing at all โ€” Every year you wait is a year of compounding you’ll never get back. A 25-year-old who starts investing has a massive structural advantage over a 35-year-old who waits “until things are more stable.” Imperfect investing started early beats perfect investing started late.

    โ“ Frequently Asked Questions

    How do I know which stocks to buy as a beginner?

    Don’t pick individual stocks as a beginner. Buy a total market index fund like VTI or VOO. These automatically include hundreds of companies, and you participate in all their growth without needing to research individual companies. As you gain experience, you can explore individual stocks โ€” but keep any individual stock positions under 10% of your portfolio.

    How much should I invest monthly?

    As much as you can consistently sustain without lifestyle sacrifice. Even $100-200/month is meaningful when started early. The rule of thumb: save and invest 15-20% of gross income. If that’s not possible yet, start wherever you can and increase as income grows.

    What happens if the market crashes right after I start?

    This is actually the best possible scenario for a long-term investor who’s just starting out. A market crash means you can buy shares at discounted prices for months or years. Every $500 monthly contribution buys more shares when prices are lower. Crashes hurt people who are about to retire; they help people who have decades ahead.

    Do I need a financial advisor?

    Most beginners do not. A simple two-fund index portfolio is straightforward enough to manage independently. If your situation is complex (business owner, stock options, significant inheritance, divorce), a fee-only fiduciary financial advisor (who charges a flat fee, not a percentage of assets) is worth consulting. Avoid advisors who earn commissions from selling products.

    Should I invest or pay down my mortgage?

    If your mortgage interest rate is below 6-7%, invest first (expected stock returns exceed the mortgage rate). If your mortgage rate is above 7%, paying down debt first offers a guaranteed return equal to your interest rate. Many people split the difference: invest enough to capture employer match, then pay down mortgage.

    Your Action Plan for This Week

    1. Open a Roth IRA or brokerage account at Fidelity or Vanguard
    2. Fund it with whatever you can โ€” even $100 to start
    3. Buy VOO or VTI
    4. Set up $200-$500 automatic monthly investment
    5. Don’t touch it for 20 years

    Back to Stock Investment Overview โ†’

    Related reading: What is stock investment ยท Stock investment strategies ยท How to open a brokerage account ยท Dollar cost averaging guide ยท Stock market for beginners

    ๐Ÿ”ฌ Deep Dive: The Psychology of Consistent Investing

    Knowing how to invest in stocks is the easy part. The hard part is the behavioral component โ€” maintaining your investment discipline when markets are volatile, your friends are bragging about winning crypto bets, and every news headline is announcing imminent economic catastrophe.

    Understanding the psychology of successful investing prepares you for the emotional challenges ahead.

    Why Your Brain Is a Bad Stock Market Investor

    Human brains evolved for survival in short-term, high-stakes environments. We’re wired to avoid loss more than we pursue gain (loss aversion), to base decisions on recent events (recency bias), and to follow the crowd (herd behavior). These instincts kept our ancestors alive on savannas. They destroy investment portfolios.

    Loss aversion in practice: Research by Kahneman and Tversky shows that the psychological pain of losing $1,000 is approximately twice as powerful as the pleasure of gaining $1,000. This means a 20% market drop feels emotionally devastating โ€” creating a powerful urge to sell and “stop the pain” โ€” even when holding is the mathematically correct decision.

    Recency bias in practice: After a 3-year bull market, investors extrapolate that stocks “always go up” and overinvest at peaks. After a crash, they extrapolate that stocks “always go down” and sell at bottoms. Both are reacting to recent events rather than the long-term probabilistic view.

    Herd behavior in practice: When everyone around you is making money on meme stocks, crypto, or some hot sector ETF, social pressure to participate can feel overwhelming. FOMO (Fear of Missing Out) drives investors to abandon diversified, boring index funds for exciting concentrated bets โ€” almost always at peak valuations, after most of the gains are already made.

    Behavioral Systems That Override Emotion

    The solution isn’t trying to suppress emotions (impossible). It’s designing systems that remove emotion from the investing process:

    Automation: Automatic monthly investments mean you don’t decide each month whether the market “looks right.” The decision was made once, rationally, when you set up the automatic transfer. Every subsequent investment happens without a new emotional decision point.

    Rules-based rebalancing: Rebalance when allocations drift beyond 5% from target (e.g., you target 70/30 US/international; rebalance when it hits 75/25 or 65/35). This removes the subjective “should I rebalance now?” question.

    Cooling-off periods: If you feel the urge to make a portfolio change (sell everything, move to cash, buy into the hot sector), impose a 7-day rule. Write down your reasoning, put it in a drawer, and revisit after 7 days. Most panic-driven decisions don’t survive a week of reflection.

    Investment policy statement: Write a one-page document stating your target allocation, rebalancing rules, contribution schedule, and investment philosophy. Review it when markets are volatile. Seeing your own written rationale, created when you were calm, provides an anchor against impulsive decisions.

    The Two Events That Will Test Your Discipline

    Event 1 โ€” The bear market: At some point in your investing life, markets will fall 30-50%. Your portfolio balance will drop significantly. Every media outlet will declare a financial crisis. Friends and family will advise you to “just move to cash until things stabilize.” This is the moment that separates long-term wealth builders from people who perpetually try to catch up.

    Historically: every US market decline (including the Great Depression, 2008 Financial Crisis, and COVID crash) has been followed by a full recovery and new all-time highs. Investors who held earned excellent long-term returns. Investors who sold and tried to “time the reentry” typically missed the recovery’s best days (which cluster at the beginning of recoveries, when sentiment is still terrible).

    Event 2 โ€” The speculative bubble: During your investing life, at least one asset class will deliver extraordinary returns for 2-5 years, attracting massive media attention and social comparison pressure. Bitcoin in 2017 and 2021, cannabis stocks in 2018, tech stocks in 1999, meme stocks in 2021. Every bubble looks obvious in retrospect and compelling in the middle.

    The prescription: allow yourself a small “exploration” allocation (5% maximum) if you feel compelled to participate. Keep the other 95% in your boring diversified index funds. This reduces FOMO while protecting the core portfolio from catastrophic loss when the bubble inevitably deflates.

    ๐Ÿ“Š Real Numbers: What Consistent Investing Actually Produces

    Abstract percentages don’t inspire action. Concrete dollar projections do. Here is what realistic, consistent stock investment produces at the individual level โ€” based on historical S&P 500 returns of approximately 10% annually (7% real returns after inflation).

    Scenario A: The Early Starter
    Age 22. Invests $300/month. Never increases contributions. Stops at age 62 (40 years). Final portfolio: approximately $1.59 million. Total contributed: $144,000. Growth from compounding: $1.45 million. Market return did 10x the work of the investor’s contributions.

    Scenario B: The Late Starter
    Age 32. Invests $300/month for 30 years. Final portfolio at 62: approximately $603,000. Same monthly contribution, 10 years later start: ends up with $986,000 less. The 10-year delay cost nearly a million dollars. Time truly is the most valuable input in investing.

    Scenario C: The Consistent Increaser
    Age 25. Starts with $200/month, increases by $50/month every 5 years as career grows. At retirement age 65: approximately $2.1 million. This is the “invest and grow contributions with your career” approach โ€” the most realistic for most people.

    The message in all three scenarios: start as early as possible, contribute consistently, and increase contributions as income grows. The specific investment vehicle (which index fund) matters far less than these three behavioral habits.

    Once your account is open, the next step is deciding which stock investment strategy fits your goals — value, growth, dividend, or index investing each has distinct advantages worth understanding.

    New to investing altogether? Our comprehensive stock market guide for beginners explains how the market works, why prices move, and the key concepts to know before your first investment.

  • What Is Stock Investment? The Complete Beginner’s Guide to Building Wealth Through Stocks

    What Is Stock Investment? The Complete Beginner’s Guide to Building Wealth Through Stocks

    What Is Stock Investment? The Complete Beginner’s Guide to Building Wealth Through Stocks

    Stock investment is the practice of purchasing shares (ownership pieces) of publicly traded companies with the goal of building long-term wealth through capital appreciation and dividend income. When you buy a stock, you become a partial owner of that company โ€” entitled to a proportional share of its profits, growth potential, and in many cases, regular dividend payments.

    This comprehensive guide explains what stock investment actually is, how it works, why ordinary people use it to build generational wealth, and the complete roadmap for getting started.

    ๐Ÿ’ก Key Insight: Stock investment isn’t gambling or speculation. It’s a systematic method of converting your labor income into ownership of real businesses โ€” allowing those businesses’ earnings and growth to compound on your behalf over decades. The historical average return of the US stock market is approximately 10% annually, which means a $10,000 investment made today could reasonably grow to $103,000 in 25 years, without any additional contributions.

    ๐ŸŽฏ What Exactly Is a Stock?

    A stock (also called a share or equity) is a certificate of partial ownership in a company. When a company decides to “go public” through an Initial Public Offering (IPO), it divides itself into millions of equal pieces called shares and sells those shares to investors on public stock exchanges (like the New York Stock Exchange or NASDAQ).

    If a company has issued 1 million shares and you own 100 shares, you own 0.01% of that company. Your ownership stake entitles you to:

    • Capital appreciation: If the company becomes more valuable, your shares become more valuable. If you bought 100 shares at $50 each ($5,000 total) and the company grows so that each share is now worth $150, your investment is now worth $15,000 โ€” a $10,000 gain.
    • Dividend payments: Many established companies distribute a portion of their profits to shareholders in the form of regular dividend payments (quarterly or annually). If you own 100 shares and the company pays a $2 annual dividend per share, you receive $200 per year in dividend income.
    • Voting rights: As a shareholder, you have the right to vote on major corporate decisions like board member elections and significant acquisitions.

    The key distinction: when you buy a stock, you’re not lending money to the company (that would be a bond). You’re purchasing actual ownership, which means your return depends entirely on how well the company performs.

    ๐Ÿ“Š The Stock Market Ecosystem

    Actor Role in Stock Market Motivation
    Public Companies Issue shares; use capital for growth Raise funds without debt; fund expansion
    Individual Investors Buy shares; provide capital; own businesses Build wealth; earn dividends; beat inflation
    Stock Exchanges Provide marketplace; process transactions Earn fees from transactions and listings
    Brokers Execute trades on behalf of investors Earn commissions and fees

    BODY_IMG_URL_1

    ๐Ÿ’ฐ Why Stock Investment Works for Building Wealth

    Stock investment has become the primary wealth-building tool for middle-class individuals in developed economies. Understanding why requires looking at the mathematics of capital appreciation and compound returns.

    Historical Returns

    The US stock market (measured by the S&P 500 index) has delivered an average annual return of approximately 10% per year over the past 90+ years, including all market crashes, recessions, wars, and pandemics. This 10% figure is the average total return, including both price appreciation and dividends.

    To put this in perspective: if you invested $10,000 in a broad US stock market index fund in 1995, your investment would have grown to approximately $180,000 by 2024 (29 years), with zero active management or stock picking. You simply bought the entire market and held it.

    Compound Returns Over Time

    Years Initial $10K at 10% Annual Return +$100/month contributions Vs. Savings Account 0.5%
    5 $16,105 $24,270 $13,060
    10 $25,937 $62,350 $16,180
    20 $67,275 $186,530 $24,975
    30 $174,494 $548,700 $36,360

    After 30 years, that initial $10,000 becomes $174,494 in the stock market versus $13,609 in a savings account. The difference of $160,885 is purely the power of compound returns.

    โš ๏ธ Important Note: These historical returns are based on past performance. The future is never guaranteed. However, the principle of compounding โ€” that time amplifies returns โ€” is mathematical fact regardless of the exact return rate. Even at 7% average returns (conservative estimate), your money still doubles approximately every 10 years.

    BODY_IMG_URL_2

    ๐Ÿ”‘ Core Principles of Stock Investment

    1. Time Horizon Matters More Than Timing

    The biggest mistake beginner stock investors make is believing they need to time the market perfectly โ€” buying before price increases and selling before crashes. This is nearly impossible and unnecessary.

    Historical data shows that an investor who bought $1,000 of S&P 500 stock market index on the worst possible day in the past 30 years (right before a major crash) and held it for 20+ years would still have made approximately 8-9% annual returns, on average. Time in the market beats timing the market.

    This is why stock investment as a discipline emphasizes long time horizons. If your investment timeline is 30+ years (until retirement), short-term price fluctuations are noise, not signals. Market crashes become buying opportunities because you’re purchasing shares at discounts.

    2. Diversification Reduces Risk

    Owning a single stock is risky. If that company faces a lawsuit, a product recall, or changing market conditions, your investment can lose 50%+ of its value. Owning 500 different companies reduces this risk dramatically.

    If one company in a 500-company index fund fails completely (loses 100% of value), your overall portfolio declines by 0.2%. This is the principle of diversification, and it’s why most stock investors use index funds or exchange-traded funds (ETFs) rather than picking individual stocks.

    For beginners especially, diversification through low-cost index funds is the recommended approach.

    3. Lower Costs = Higher Returns

    Every percentage point you pay in fees or expenses directly reduces your returns. An actively managed mutual fund charging 1% in annual fees will deliver returns 1% lower than a passive index fund charging 0.05% annually โ€” assuming both track the same market.

    Over 30 years, this 0.95% annual difference compounds into a massive divergence. On a $100,000 investment with 10% gross returns, the fee difference alone costs you $103,000+ in lost compound growth.

    This is why low-cost index funds (like VOO, VTSAX, or FSKAX) have become the default choice for wealth building.

    ๐Ÿ“ˆ The Complete Stock Investment Roadmap

    Step 1: Establish Your Financial Foundation (0-3 months)

    Before you buy a single share, ensure:

    • Emergency fund established: 3-6 months of living expenses in a liquid, accessible savings account. Stock investments should be for money you won’t need in the next 5+ years.
    • High-interest debt eliminated: Credit card balances, high-interest personal loans. It makes no sense to earn 10% returns on stocks while paying 18% interest on credit cards.
    • Retirement accounts maximized: If your employer offers a 401(k) match, contribute enough to capture the full match. This is free money.

    Step 2: Open a Brokerage Account (1-2 hours)

    A brokerage account is simply an account at a financial institution (Fidelity, Vanguard, Charles Schwab, Interactive Brokers, etc.) that allows you to buy and sell stocks. The process:

    • Choose a broker (most charge zero commissions on stock trades; fees are minimal)
    • Complete the application (5-10 minutes online)
    • Verify your identity and link a bank account
    • Deposit funds

    For most beginners, Fidelity, Vanguard, or Charles Schwab are solid choices. All three offer excellent low-cost index funds, responsive customer service, and educational resources.

    Step 3: Invest in Low-Cost Index Funds (Not Individual Stocks)

    Rather than trying to pick winning individual stocks (which most people fail at), invest in broad market index funds or ETFs. These track entire market segments automatically.

    Fund Tracks Expense Ratio Best For
    VOO / VTSAX S&P 500 (500 large US companies) 0.03% Core holding โ€” most people
    VTSAX / VTI Entire US stock market (4000+ companies) 0.03% Maximum US diversification
    VXUS / VTIAX International stock markets 0.08% Global diversification
    SCHX / SPLG S&P 500 via Schwab / Splitter 0.03% Alternatives via other brokers

    For most beginners: invest 70-80% of your portfolio in VOO (or VTSAX if using Vanguard) and 20-30% in VXUS (international exposure). Set it and forget it. Let compounding do the work.

    Step 4: Implement Dollar-Cost Averaging

    Dollar-cost averaging (DCA) means investing a fixed amount of money at regular intervals โ€” regardless of whether the market is up or down. Examples:

    • Invest $500 every month into VOO
    • Invest $5,000 every quarter
    • Invest your entire annual bonus into stock funds

    DCA removes the emotional component of trying to time the market. You invest regularly, and over decades, you average out the market’s ups and downs. When prices are low (market crashes), your fixed investment buys more shares. When prices are high, it buys fewer shares. The average price you pay smooths out market volatility.

    Step 5: Reinvest Dividends Automatically

    Most brokers offer DRIP (Dividend Reinvestment Plan) accounts. Rather than receiving dividend payments as cash, the dividends automatically purchase additional shares. This accelerates compounding significantly.

    On a $100,000 portfolio earning 10% average returns (comprising 7% price appreciation + 3% dividends) with dividends reinvested: after 30 years, your portfolio grows to $1.74 million. Without reinvested dividends (taking dividend cash and spending it), your portfolio grows to only $1.57 million. The difference is $170,000+ from dividends alone.

    Step 6: Rebalance Annually

    Once per year (or every other year), rebalance your portfolio back to your target allocation. If your target is 70% VOO / 30% VXUS but market movements have shifted you to 75% / 25%, sell some VOO and buy VXUS to restore the balance.

    This forces you to “sell high” (rebalancing away from outperforming positions) and “buy low” (rebalancing toward underperforming positions), which is the opposite of emotional investing.

    ๐ŸŽ“ Common Beginner Mistakes to Avoid

    Mistake 1: Trying to pick individual winning stocks. Even professional stock pickers fail to beat the market consistently. For beginners, individual stock picking is a distraction from the core principle: buy diversified low-cost index funds and hold for decades.

    Mistake 2: Panic selling during market crashes. Market corrections (10-20% declines) happen roughly every 5 years. Bear markets (20%+ declines) happen every 7-10 years on average. If you sell during these declines, you lock in losses and miss the recovery. Historically, every bear market has been followed by a new all-time high within 3-5 years.

    Mistake 3: Chasing recent winners. The funds that had the best performance last year often underperform next year. Don’t chase performance. Stick to your allocation.

    Mistake 4: Paying high fees for active management. Actively managed funds charging 0.5-1.5% annually underperform their low-cost index fund equivalents over time due to fee drag alone. Use low-cost index funds (0.03-0.10% expense ratios).

    Mistake 5: Insufficient diversification. Holding only 2-3 individual stocks is risky. Use index funds to own hundreds of companies automatically.

    โœ… Success Pattern: The most successful stock investors share a common trait: they’re boring. They set a target allocation (70% VOO / 30% VXUS), invest $500-$1,000 monthly, reinvest dividends, and don’t check their portfolio daily. They ignore market noise and let time + compounding build wealth. This approach is available to anyone.

    Ready to start? Follow our complete guide on how to invest in stocks step by step.

    โ“ Frequently Asked Questions

    How much money do I need to start investing in stocks?

    Most brokers allow you to open an account with as little as $1-$10. Some charge no minimum account balance. You could technically start with $100, but I recommend building up to at least $1,000-$2,000 so that compounding becomes meaningful. However, don’t wait until you have perfect conditions. Start small and increase contributions as your income grows.

    What’s the difference between stocks, ETFs, and mutual funds?

    Stocks: Individual company shares. You own part of one company. Higher risk, requires research or luck to succeed.

    ETFs (Exchange-Traded Funds): Baskets of stocks that trade like a single stock. VOO is an ETF holding 500 large US companies. You own all 500 with one purchase. Lower costs, automatic diversification.

    Mutual Funds: Similar to ETFs but older technology. Can hold stocks or bonds. Some are actively managed (higher fees) and some are passive index funds (lower fees). For beginners, low-cost index ETFs are the modern choice.

    Should I invest all at once or gradually?

    If you have a lump sum ($100,000), research shows investing it all immediately performs better on average than dollar-cost averaging it over time. However, if you’re psychologically uncomfortable with market risk, dollar-cost averaging over 6-12 months can reduce anxiety without significantly impacting long-term returns.

    How often should I check my portfolio?

    For long-term investors, checking less frequently is better. Daily or weekly checking increases emotional decision-making and anxiety. Many successful investors check their portfolio once or twice per year. If you’re prone to panic selling, check even less frequently.

    Is stock investment for everyone?

    Stock investment is appropriate for anyone with a 5+ year time horizon and the psychological ability to hold through market volatility. If you need the money within 5 years or you’ll panic and sell during inevitable downturns, stocks may not be suitable. For money you won’t need until retirement (20-50 years away), stocks are statistically the most effective wealth-building vehicle available to ordinary people.

    Ready to Start Your Stock Investment Journey?

    You now understand the fundamentals. The next step is action: open a brokerage account, fund it with your first investment, and begin. The best time to plant a tree was 20 years ago. The second best time is today.

    Get Started Now โ†’

    ๐Ÿ”— Related Guides to Deepen Your Knowledge

    Now that you understand what stock investment is, explore these related topics:

    How does the stock market work ยท What is a stock in detail ยท Stocks vs bonds ยท How to invest in stocks step-by-step ยท Stock investment strategies for all types of investors

    ๐Ÿ“š Deep Dive: The Psychology and History Behind Stock Investment

    Understanding why stock investment works isn’t just about mathematics โ€” it’s about understanding human nature and capital allocation in market economies.

    Why Companies Create Value

    When you own a stock, you own a claim on a company’s future earnings. A well-managed company continuously invests in better products, more efficient operations, and expanded markets. Over time, this investment increases the company’s profitability. Higher profitability means higher per-share earnings, which drives stock price appreciation.

    Consider Apple’s evolution: in 1997, Apple was nearly bankrupt. Steve Jobs returned and refocused the company on simplicity and design. Over the next 25 years, through continuous reinvestment in R&D, retail operations, and brand building, Apple became the most valuable company in the world. An investor who bought Apple stock in 1997 at $25/share for $2,500 (100 shares) would own stock worth over $1.6 million in 2024. The stock increased 64,000% because Apple’s management reinvested in building a better company.

    This is what you’re betting on when you own stocks: management teams making smart decisions that compound value over decades.

    The Role of Economic Growth

    Stock returns ultimately derive from economic growth. When an economy grows (more production, more consumption, higher productivity), companies within that economy become more profitable. Their profits are distributed to shareholders as dividends or reinvested for growth (which increases stock prices).

    The US economy has grown approximately 3-4% annually on average for the past 150 years, even through recessions, depressions, wars, and pandemics. This consistent economic growth is the underlying reason stocks have delivered positive long-term returns. When you invest in stocks, you’re essentially betting that human innovation and productivity will continue advancing โ€” a bet that has never failed over any 30-year period in modern history.

    Why Market Crashes Happen (And Why They Matter Less Than You Think)

    Stock markets crash when investor sentiment shifts dramatically โ€” typically triggered by fear about future earnings or macroeconomic uncertainty. The 2008 financial crisis crashed the S&P 500 by 57%. COVID-19 crashed it by 34%. Yet within 3-5 years, both crashes were fully recovered, and new all-time highs were set.

    For long-term investors, crashes are feature, not bugs. Crashes are when stocks are cheapest โ€” the best time to buy if you have cash available. The “worst” thing that can happen to a young investor is that the market crashes right after they start investing, because they can then invest their monthly contributions at deeply discounted prices for years.

    Market crashes are only catastrophic if you’re forced to sell (needed the money) or if you panic and sell at the bottom. For patient, long-term investors with stable income, crashes are buying opportunities.

    ๐ŸŽ“ Stock Investment Myths Debunked

    Myth 1: Stock investing is gambling. Gambling has negative expected value โ€” the house has an edge. Stock investing over 30+ years has positive expected value based on 150+ years of historical data. The mathematics are entirely different.

    Myth 2: You need to pick winners to get rich. Warren Buffett recommends that 90% of his estate be invested in a simple S&P 500 index fund. He’s an exceptional stock picker, and even he recommends passive indexing for most people. This should tell you something about the difficulty of stock picking.

    Myth 3: The market is rigged against small investors. Modern brokerage commissions are zero. Information is widely available. Regulatory protections exist. Small investors have never had better conditions. The barrier to entry is approximately $100 and one hour of time.

    Myth 4: Successful investing requires constant monitoring. Research shows that investors who trade frequently (trying to time the market) underperform buy-and-hold investors. The best investors are sometimes called “lazy” investors because they rarely trade.

    Myth 5: You should wait for the “perfect time” to start. Markets are near all-time highs regularly. If you wait for a crash before investing, you might miss decades of gains. Time in the market beats timing the market. The perfect time to start is right now โ€” or ten years ago. The second-best time is today.

    ๐Ÿ’ก The Wealth-Building Math You Need to Know

    Three variables determine your long-term stock investment results:

    1. Time horizon: How long until you need the money? 30 years beats 10 years beats 5 years. Longer time horizons allow you to ride out volatility and benefit from compounding.

    2. Amount invested: Monthly contributions compound just like returns do. Investing $500/month for 30 years at 10% annual returns grows to approximately $1.1 million. Investing $1,000/month grows to $2.2 million. Doubling your monthly contribution doubles your final result.

    3. Costs (fees): Lower fees mean higher returns reach your pocket instead of going to fund managers and advisors. A 0.5% fee difference compounds into hundreds of thousands over 30 years. Use low-cost index funds exclusively.

    You cannot control market returns (trying is futile). You can absolutely control time horizon, contribution amount, and fees. Focus on what’s controllable.

    ๐Ÿš€ Advanced Concepts for Serious Investors

    Once you’ve mastered the fundamentals, several advanced concepts can optimize returns:

    Asset location: Different account types have different tax treatments. Bonds in taxable accounts are inefficient (taxes on interest). Tax-advantaged accounts (401k, Roth IRA) should hold high-return investments. Efficient asset location can increase after-tax returns by 0.5-1% annually.

    Tax-loss harvesting: In taxable accounts, selling losing positions and immediately repurchasing similar (but not identical) positions allows you to lock in tax losses that offset gains elsewhere. This is free money from tax optimization.

    International diversification: Owning 30% international stocks (via VXUS or similar) provides diversification benefits and exposure to different economic cycles.

    Factor investing: Research suggests that value stocks (cheap on valuation metrics) and quality stocks (strong fundamentals) have historically outperformed. Some investors allocate a portion of their portfolio to value-tilted or quality-tilted index funds.

    However: don’t get distracted by optimization. The difference between a “perfect” allocation and a “good” allocation is 0.1-0.2% annually. The difference between investing and not investing is 5-10% annually. Start simple; optimize later.

    ๐Ÿ’– The One Principle That Matters Most: Stock investment isn’t complicated. Buy low-cost diversified index funds, contribute consistently, reinvest dividends, hold through volatility, and check back in 30 years. That’s the whole system. Everything else is either unnecessary detail or emotional noise.

    Ready to choose your investing approach? Read our complete guide to stock investment strategies to find the right method for your goals and temperament.

    Ready to find specific companies? Read our guide on how to identify the best stocks to invest in using a proven 5-factor evaluation framework.

    New to investing altogether? Our comprehensive stock market guide for beginners explains how the market works, why prices move, and the key concepts to know before your first investment.

    Want to understand the mechanics behind every price move? Read our deep-dive on how the stock market works โ€” order books, price discovery, and the invisible auction explained.